监测ASP.NET应用程序性能有很多种方法,你心目最简单的方法是什么?
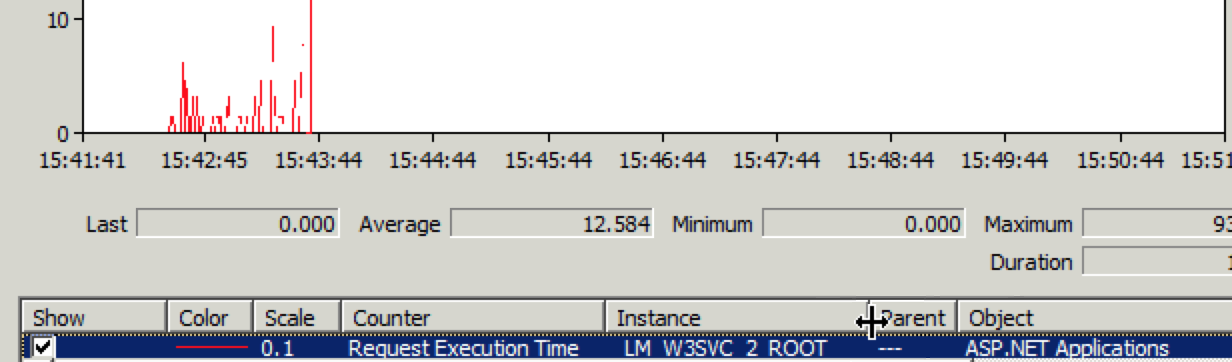
我目前找到的最简单的方法是:在Windows性能监视器(Performact Monitor)中监测ASP.NET Applications的Request Execution Time参数。

微软网站上对Request Execution Time的解释:
This counter shows the time, in milliseconds, that it takes to render the last requested page and then transmit it to the user. This counter will generally be greater than the time a trace shows to render the page. This counter is a more comprehensive measurement of start-to-finish request time. If this counter shows a lower average when compared to a baseline, then both the scalability and the performance of the application have been increased.
我对Request Execution Time的理解是:ASP.NET Runtime接收到IIS转发过来的用户请求->ASP.NET Runtime将该请求的响应内容发送给IIS所消耗的时间。
在Windows性能监视器中添加Request Execution Time计数器的操作步骤:
1. 打开Windows性能监视器,点击加号按钮。
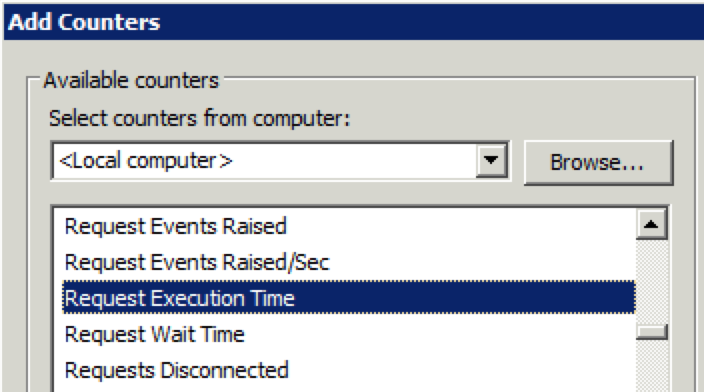
2. 找到ASP.NET Applications

3. 找到Request Execution Time
4. 选择要监测的ASP.NET站点
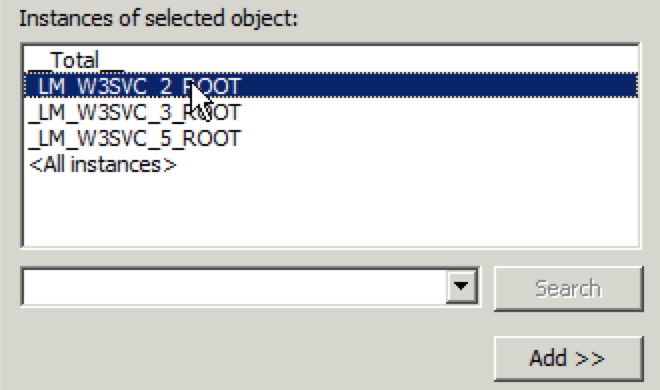
LM_W3SVC_2_ROOT表示ID为2的IIS站点,站点ID可以在IIS的站点列表中查看到。
5. 点击Add
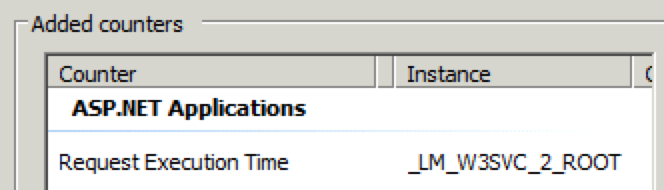
6. 点击OK
如果你有更简单的方法,期待你的分享。