Prometheus
ubuntu安装prometheus非常简单:
apt update
apt install prometheus
systemctl enable prometheus
systemctl enable prometheus-node-exporter
apt安装prometheus和prometheus-node-exporter之后便带有基本配置,无需修改。
确保开启服务开启:
systemctl status prometheus
systemctl status prometheus-node-exporter
顺便使用它监控mongodb,安装prometheus-mongodb-exporter:
apt install prometheus-mongodb-exporter
systemctl enable prometheus-mongodb-exporter
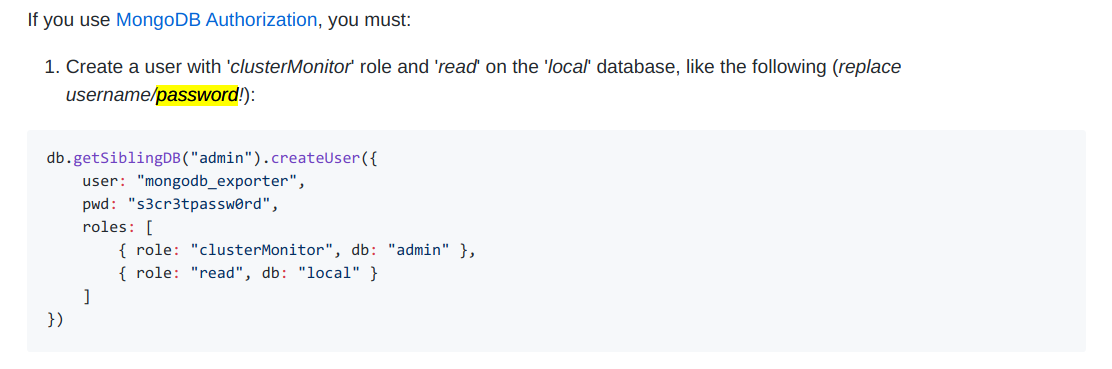
此外由于mongodb开启了密码验证,需要注意mongodb用户的权限:mongodb_exporter github链接
然后需要修改 /etc/default/prometheus-mongodb-exporter 中的 ARGS 如下:
# ARGS='-mongodb.uri="mongodb://localhost:27017"'
ARGS='-mongodb.uri="mongodb://xxx:xxxxx@localhost:27017"'
mongodb URI格式如下:
mongodb://[username:password@]host1[:port1][,...hostN[:portN]][/[database][?options]]
如果 username 或 password 包含 @ : / % 四种符号需要使用 百分号编码.
错误添加需要删除时用db.getSiblingDB("admin").dropUser("mongodb_exporter")
然后重启一下服务
systemctl restart prometheus-mongodb-exporter
Grafana
安装:
sudo add-apt-repository "deb https://packages.grafana.com/oss/deb stable main"
wget -q -O - https://packages.grafana.com/gpg.key | sudo apt-key add -
apt update
apt install grafana
配置:
配置文件为 /etc/grafana/grafana.ini,注意如下内容:
...
[server]
domain = www.xxxx.com
enforce_domain = true
root_url = %(protocol)s://%(domain)s/grafana
...
[security]
admin_password = xxxx
然后访问 www.xxxx.com/grafana 登录,用户名admin,密码为上面设置的admin_password。
然后按照 [这里][https://github.com/percona/grafana-dashboards] 配置数据源使用prometheus,并导入面板。一般导入这些即可:
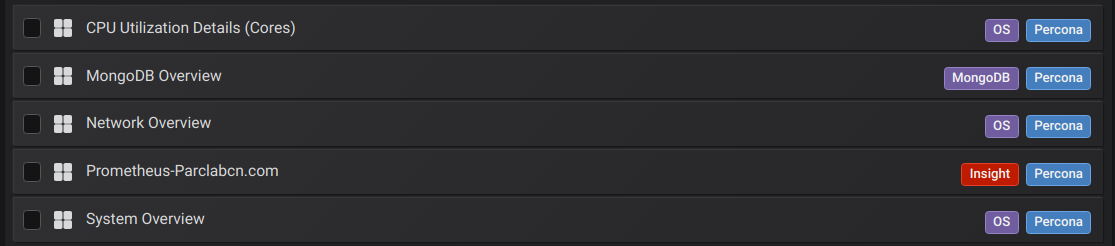
(注意:json中的pmm-singlestat-panel可能需要替换为singlestat)
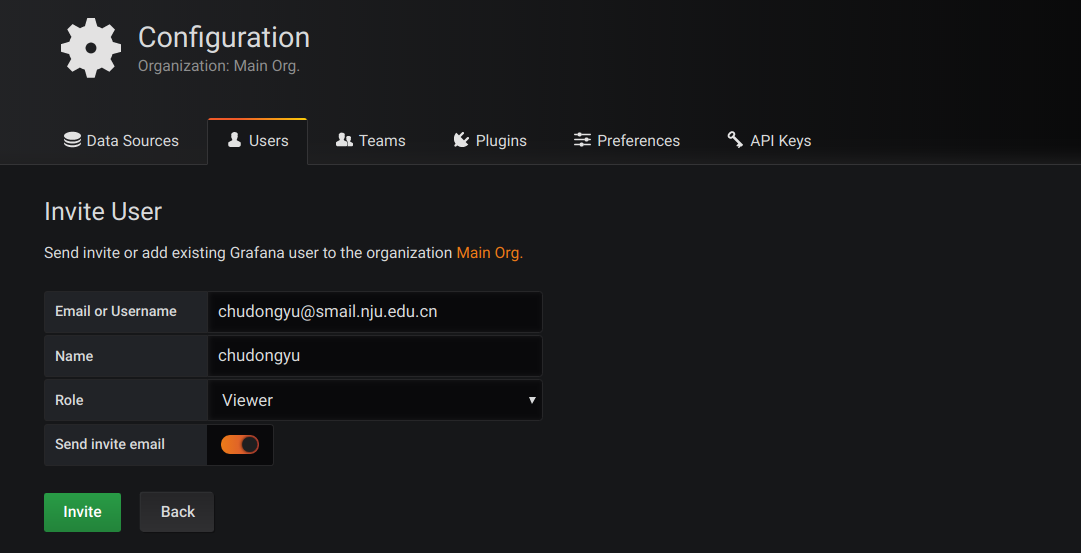
使用Viewer角色用户登录查看
上述Dashboard配置好之后,不应继续使用admin登录系统。
在设置中“邀请”用户,填写自己的邮箱然后通过邮箱链接设置密码,即可以自己的邮箱登录grafana。

注:
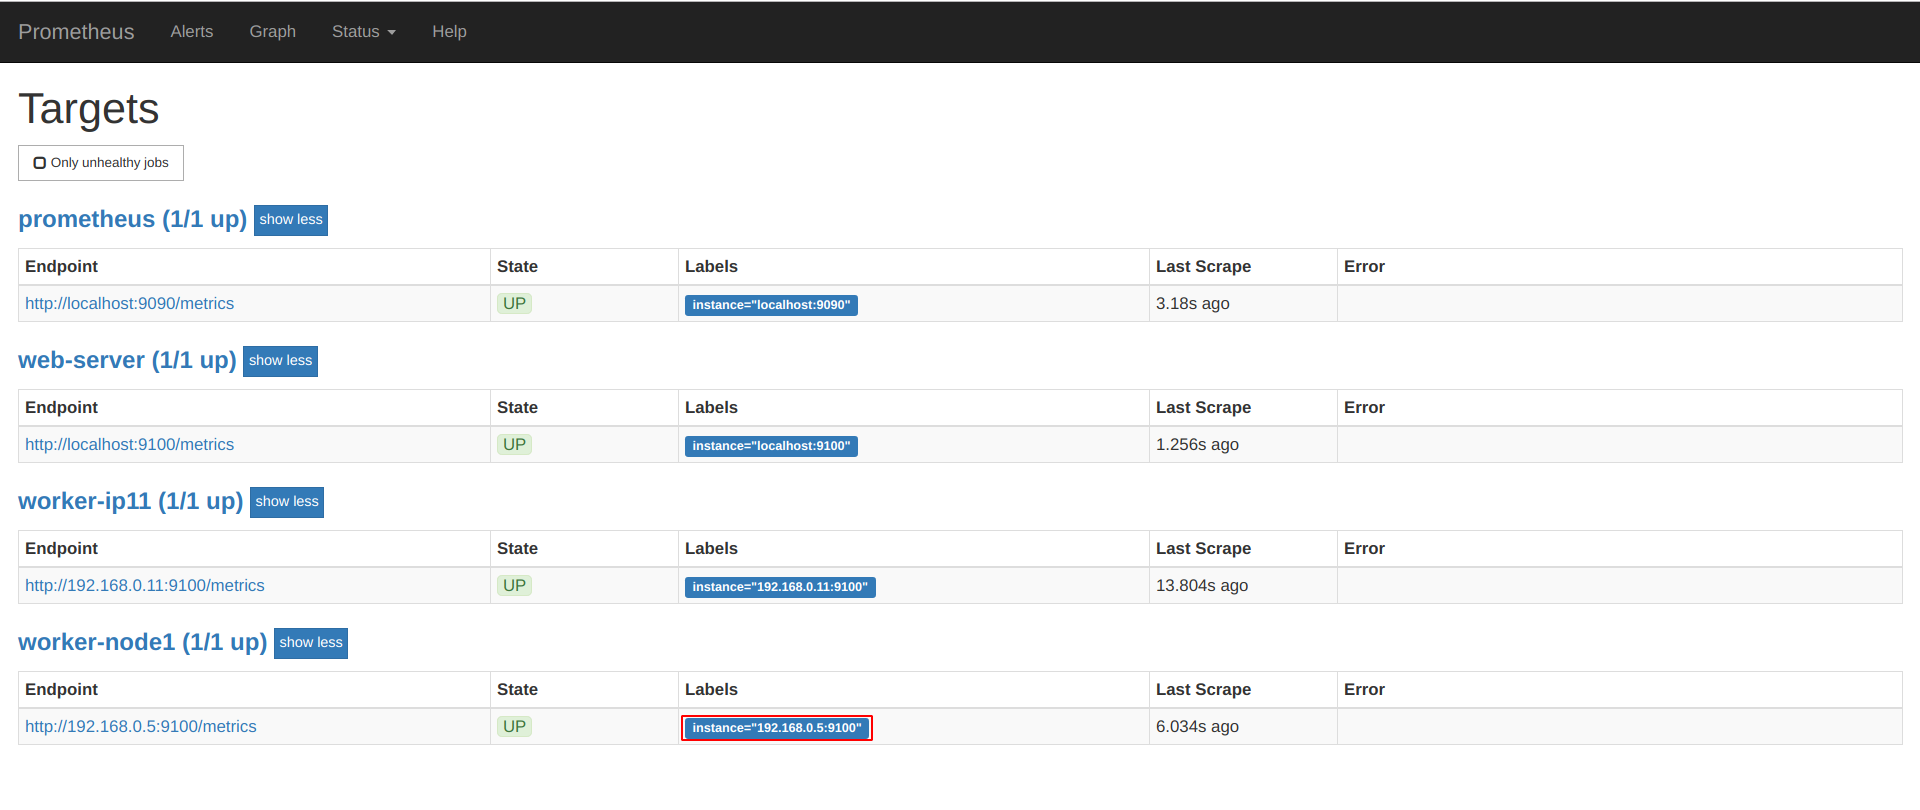
使用prometheus监控两台服务器,配置文件 /etc/prometheus/prometheus.yml 内容如下:
# Sample config for Prometheus.

global:
  scrape_interval:     15s # By default, scrape targets every 15 seconds.
  evaluation_interval: 15s # By default, scrape targets every 15 seconds.
  # scrape_timeout is set to the global default (10s).

  # Attach these labels to any time series or alerts when communicating with
  # external systems (federation, remote storage, Alertmanager).
  external_labels:
      monitor: 'example'

# Load and evaluate rules in this file every 'evaluation_interval' seconds.
rule_files:
  # - "first.rules"
  # - "second.rules"

# A scrape configuration containing exactly one endpoint to scrape:
# Here it's Prometheus itself.
scrape_configs:
  # The job name is added as a label `job=<job_name>` to any timeseries scraped from this config.
  - job_name: 'prometheus'

    # Override the global default and scrape targets from this job every 5 seconds.
    scrape_interval: 5s
    scrape_timeout: 5s

    # metrics_path defaults to '/metrics'
    # scheme defaults to 'http'.

    static_configs:
        - targets: ['localhost:9090']

  - job_name: "web-server"
    # If prometheus-node-exporter is installed, grab stats about the local
    # machine by default.
    static_configs:
      - targets: ['localhost:9100']

  - job_name: "worker-node1"
    static_configs:
      - targets: ['192.168.0.5:9100']
这个配置是没问题的,在另一台机器 (192.168.0.5) 上安装并启用 prometheus-node-exporter 即可。
但如果你仅仅修改了某个job_name(而没有修改ip),比如把web-server改为node,那么grafana界面中的singlestat panel将不能正确显示,显示“Only queries that return single...”,
这是因为singlestat只能显示一个结果,而查询语句查到了两个结果。解决方式是删除之前的数据系列:
-
首先停止prometheus服务,传入
--web.enable-admin-api参数手动运行 -
然后这样删除:
curl -X POST -g 'http://localhost:9090/api/v1/admin/tsdb/delete_series?match[]={instance="localhost:9100"}'
参考链接:Prometheus: Delete Time Series Metrcs
注2:上述情况的查询语句可能是这样的(可以在grafana中看到):
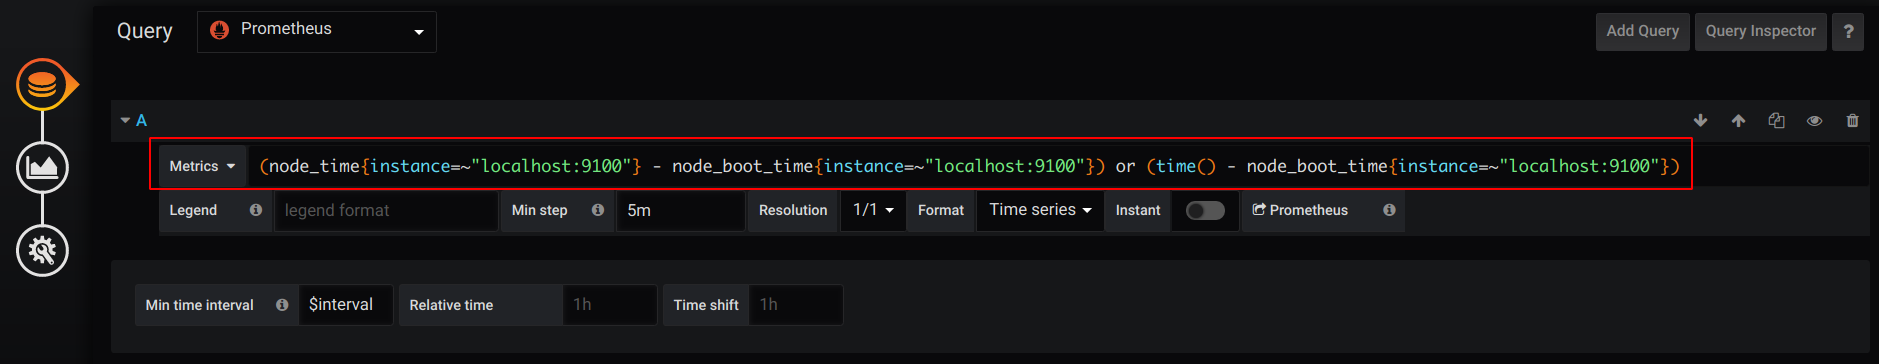
(可以用instance="xxxxx"或job="xxxxx")
清理数据参考链接:
https://prometheus.io/docs/prometheus/2.3/querying/api/#delete-series
https://www.alibabacloud.com/help/zh/doc-detail/56246.htm
prometheus 默认是9090端口: