上一节我们讲述了在地图上加载图标,以及监听鼠标点击事件,这一节我么来讲述如何在海图上描绘船舶历史航迹图,航迹图的描绘实际上是航迹点的描绘和点之间的线段的描绘,其实也是在海图上添加ol.vector.layer图层 图层是通过featrue json 方式加载的,下面我们具体来研究一下
/**
 * 根据数组内容获得Feature
 * @param tailpoint json 包含航迹数据的航迹点
 * @param coordinate 航迹点的经纬度坐标
 * @returns  点featrue
 *
 */
function getFeaturepoint(trailpoint,coordinate) {
	if (!isNaN(coordinaete[0]) && !isNaN(coordinaete[1])) {
		shiptrailfeature = new ol.Feature({
			geometry : new ol.geom.Point(coordinate),
			'type' : 'portship',
			"course" : trailpoint[3],
			'time' : trailpoint[0],
			'speed' : trailpoint[4]
		});
		return shiptrailfeature;
	} else {
		return null;
	}
}

/**
 * 获取航迹点的之间的线段featrue
 * @param coordinaete1  端点坐标1
 * @param coordinaete2  端点坐标2
 * @returns 线段 featrue
 */
function getFeatureline(coordinaete1,coordinaete2) {
	if (!isNaN(coordinaete1[0]) && !isNaN(coordinaete1[1])) {
		shiptrailfeature = new ol.Feature({
			geometry : new ol.geom.LineString ([coordinaete2,coordinaete1])
		});
		return shiptrailfeature;
	} else {
		return null;
	}
}

//轨迹的显示
function historyzoom() {

	geojsonObject = gethistorygeojson()
	var vectorSource = new ol.source.Vector({
		features : geojsonObject
	});
	map.removeLayer(traillayer);
	traillayer = new ol.layer.Vector({
		source : vectorSource,
		style : styleFunction2
	});
	map.addLayer(traillayer);

}
//获取轨迹点的 featrue  json
function gethistorygeojson() {
	var featrues = [];
	var coordinaeteold;  //端点1
	var coordinaetenew; // 端点2
	var latold;
	var lonold;
	// 实际使用时tail是从后天传输的数据,这是一个数据示例
	trial=[['2020-6-1 11:58',119,39,311,10],['2020-6-1 12:02',119.01,39.01,311,10],['2020-6-1 12:05',119.02,39.02,311,10]]

	for (var i = 0; i < trail.length; i++) {
		if (i == 0) {
				lonold = parseFloat(trail[i][1]);
				latold = parseFloat(trail[i][2]);
				coordinaeteold = ol.proj.transform([ lonold, latold ],'EPSG:4326', 'EPSG:3857');
				featurepoint = getFeaturepoint(trail[i],coordinaeteold);
				if (featurepoint != null) {
					featrues.push(featurepoint);
				}

		} else {
				var lonnew = parseFloat(trail[i][1]);
				var latnew = parseFloat(trail[i][2]);
				coordinaetenew = ol.proj.transform([ lonnew, latnew ],
						'EPSG:4326', 'EPSG:3857');
				if (!isNaN(coordinaetenew[0]) && !isNaN(coordinaetenew[1])) {
					featurepoint = getFeaturepoint(trail[i],coordinaetenew);
					if (featurepoint != null) {
						featrues.push(featurepoint);
					}
					featureline = getFeatureline(coordinaetenew,coordinaeteold);
					if (featureline != null) {
						featrues.push(featureline );
					}
						coordinaeteold = coordinaetenew;
						latold = latnew;
						lonold = lonnew;
				}

			}
		}

	return featrues
}
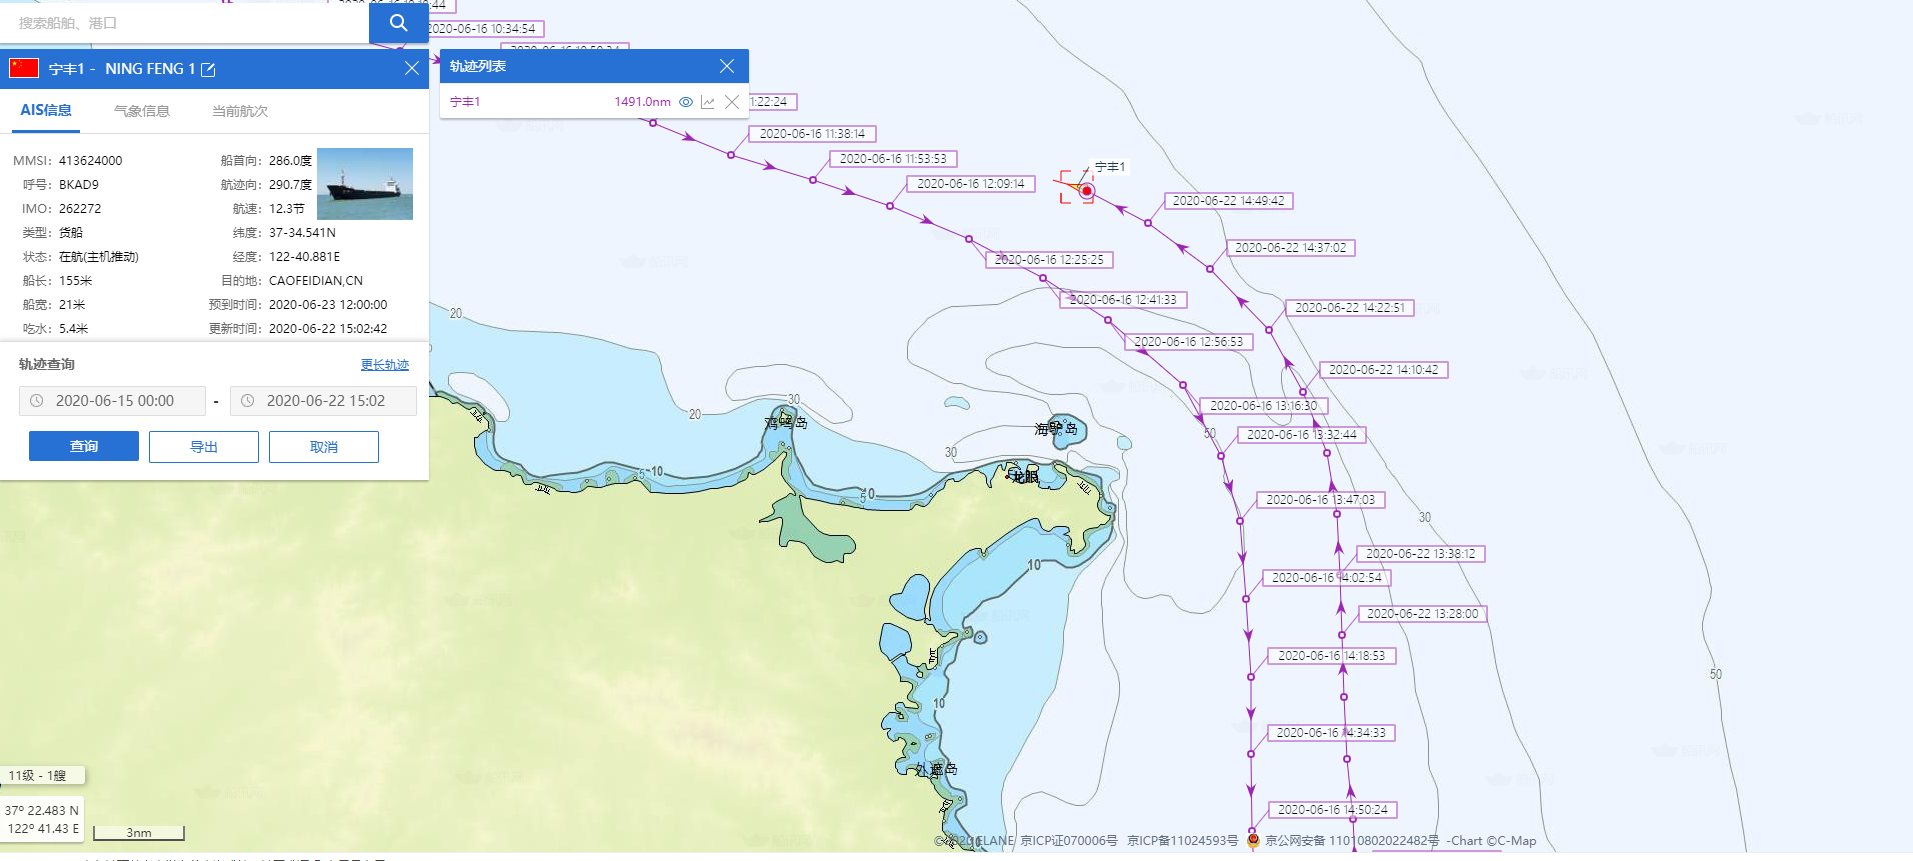
实际效果如下图