前提条件:已安装好java环境,tomcat,influxdb和collectd。本文暂不提供以上内容的安装步骤
系统环境:centos7
原理:开启tomcat的jmx端口,使用collectd的collectd-fast-jmx插件收集jmx信息,collectd把数据存储到infludb,再由grafana展示infludb的数据
1,开启tomcat的jmx配置
cd /usr/local/tomcat/bin/
cp catalina.sh catalina.sh.bak
vim catalina.sh
增加:CATALINA_OPTS="$CATALINA_OPTS -Dfile.encoding=utf-8 -Dcom.sun.management.jmxremote -Dcom.sun.management.jmxremote.port=9999 -Dcom.sun.management.jmxremote.ssl=false -Dcom.sun.management.jmxremote.authenticate=false -Djava.rmi.server.hostname=127.0.0.1"
重启tomcat
/etc/init.d/tomcat restart
netstat -nltp
看到9999端口开启就表示jmx开启成功了
2,下载collectd-fast-jmx插件
从http://www.mvnjar.com/com.e-gineering/collectd-fast-jmx/1.0.0/detail.html下载插件拷贝到机器上并重命名为collectd-fast-jmx.jar
cd /tmp
wget http://maven.aliyun.com/nexus/content/groups/public/com/e-gineering/collectd-fast-jmx/1.0.0/collectd-fast-jmx-1.0.0.jar
cd /opt/collectd/share/collectd/java/
mv /tmp/collectd-fast-jmx-1.0.0.jar collectd-fast-jmx.jar
3,编辑collectd配置文件并启动collectd
collectd插件的安装比较简单,下载jar包,在配置文件中添加相关配置就可以了。collectd有丰富的插件可以使用,免去了自己写监控脚本的繁琐。
cd /opt/collectd/etc
cp collectd.conf collectd.conf.bak
vim collectd.conf
增加如下内容:
LoadPlugin java
<Plugin "java">

  LoadPlugin "com.e_gineering.collectd.FastJMX"

   <Plugin "FastJMX">
    MaxThreads 256
    CollectInternal true

    <MBean "classes">
      ObjectName "java.lang:type=ClassLoading"

      <Value "LoadedClassCount">
        Type "gauge"
        InstancePrefix "loaded_classes"
        PluginName "JVM"
      </Value>
    </MBean>

    # Time spent by the JVM compiling or optimizing.
    <MBean "compilation">
      ObjectName "java.lang:type=Compilation"

      <Value "TotalCompilationTime">
        Type "total_time_in_ms"
        InstancePrefix "compilation_time"
        PluginName "JVM"
      </Value>
    </MBean>

    # Garbage collector information
    <MBean "garbage_collector">
      ObjectName "java.lang:type=GarbageCollector,*"
      InstancePrefix "gc-"
      InstanceFrom "name"

      <Value "CollectionTime">
        Type "total_time_in_ms"
        InstancePrefix "collection_time"
        PluginName "JVM"
      </Value>
    </MBean>

  <MBean "memory_pool">
    ObjectName "java.lang:type=MemoryPool,*"
    InstancePrefix "memory_pool-"
    InstanceFrom "name"
    <Value>
      Type "memory"
      Table true
      Attribute "Usage"
    </Value>
  </MBean>
   <MBean "memory-heap">
    ObjectName "java.lang:type=Memory"
    InstancePrefix "memory-heap"
    <Value>
      Type "memory"
      Table true
      Attribute "HeapMemoryUsage"
    </Value>
  </MBean>
  <MBean "memory-nonheap">
    ObjectName "java.lang:type=Memory"
    InstancePrefix "memory-nonheap"
    <Value>
      Type "memory"
      Table true
      Attribute "NonHeapMemoryUsage"
    </Value>
  </MBean>
   <MBean "thread">
    ObjectName "java.lang:type=Threading"
    InstancePrefix "threading"
    <Value>
      Type "gauge"
      Table false
      Attribute "ThreadCount"
      InstancePrefix "count"
    </Value>
  </MBean>
  <MBean "thread-daemon">
    ObjectName "java.lang:type=Threading"
    InstancePrefix "threading"
    <Value>
      Type "gauge"
      Table false
      Attribute "DaemonThreadCount"
      InstancePrefix "count-daemon"
    </Value>
  </MBean>
    ### MBeans by Catalina / Tomcat ###
    # The global request processor (summary for each request processor)
    <MBean "catalina/global_request_processor">
      ObjectName "Catalina:type=GlobalRequestProcessor,*"
      InstancePrefix "catalina_request_processor-"
      InstanceFrom "name"

      <Value>
        Type "io_octets"
        InstancePrefix "global"
        #InstanceFrom ""
        Table false
        Attribute "bytesReceived"
        Attribute "bytesSent"
      </Value>

      <Value>
        Type "total_requests"
        InstancePrefix "global"
        #InstanceFrom ""
        Table false
        Attribute "requestCount"
      </Value>

      <Value>
        Type "total_time_in_ms"
        InstancePrefix "global-processing"
        #InstanceFrom ""
        Table false
        Attribute "processingTime"
      </Value>
    </MBean>

    <MBean "catalina/threadpool">
      ObjectName "Catalina:type=ThreadPool,*"
      InstancePrefix "catalina_threadpool-"
      InstanceFrom "name"

      <Value>
        Type "gauge"
        Table false
        Attribute "maxThreads"
        InstancePrefix "threadpool-maxThreads"
      </Value>
      <Value>
        Type "gauge"
        Table false
        Attribute "connectionCount"
        InstancePrefix "threadpool-connectionCount"
      </Value>
    </MBean>

    <MBean "tomcat_manager">
         ObjectName "Catalina:type=Manager,context=*,host=*"
         InstanceFrom "context"
         <Value>
            Type "gauge"
            InstancePrefix "manager-active_sessions"
            Table false
            Attribute "activeSessions"
        </Value>
    </MBean>

    <MBean "jvm_runtime">
      ObjectName "java.lang:type=Runtime"
      <Value>
        Type "counter"
        InstancePrefix "runtime-uptime"
        Table false
        Attribute "Uptime"
      </Value>
    </MBean>

     <MBean "jvm_system">
       ObjectName "java.lang:type=OperatingSystem"
       <Value>
         Type "gauge"
         InstancePrefix "os-open_fd_count"
         Table false
         Attribute "OpenFileDescriptorCount"
       </Value>
       <Value>
         Type "counter"
         InstancePrefix "os-process_cpu_time"
         Table false
         Attribute "ProcessCpuTime"
       </Value>
     </MBean>
    <Connection>
      ServiceURL "service:jmx:rmi:///jndi/rmi://testserver:9999/jmxrmi"
      Host "testserver"
      IncludePortInHostname true
      Collect "classes"
      Collect "thread"
      Collect "thread-daemon"
      Collect "compilation"
      Collect "garbage_collector"
      Collect "memory_pool"
      Collect "memory-heap"
      Collect "memory-nonheap"
      Collect "catalina/global_request_processor"
      Collect "catalina/threadpool"
      Collect "jvm_system"
      Collect "jvm_runtime"
      Collect "tomcat_manager"
    </Connection>
  </Plugin>
</Plugin>
校验配置文件 /opt/collectd/sbin/collectd -t编辑完成后保存退出
没问题的话就重启collectd
ps -ef |grep collectd
kill -9 6669(这里是进程号)
/opt/collectd/sbin/collectd
4,配置grafana,使用的是网上的模板
grafana面板下载地址:
https://grafana.com/dashboards/1503
可以看出面板的编号是1503
接下来配置下grafana就可以了
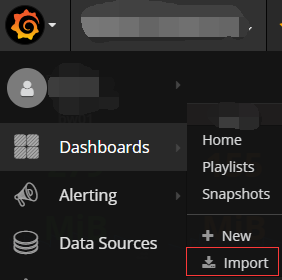
(1)在主页选择”dashboards"->"improt"进行模板导入
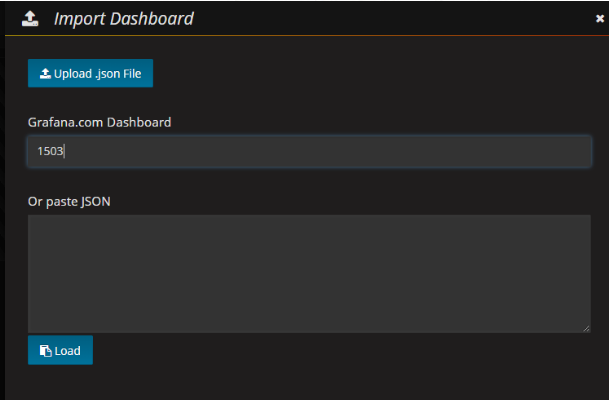
(2)输入模板编号1503,再点击load
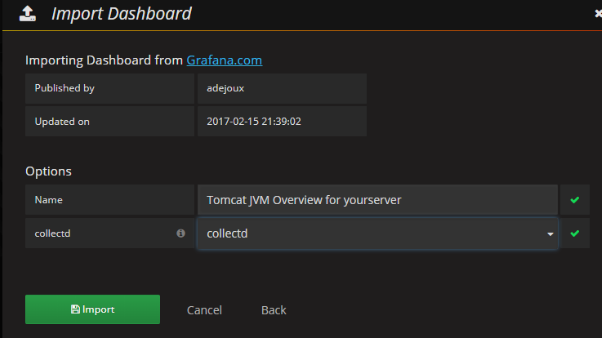
(3)输入面板名字,选择数据源,点击import
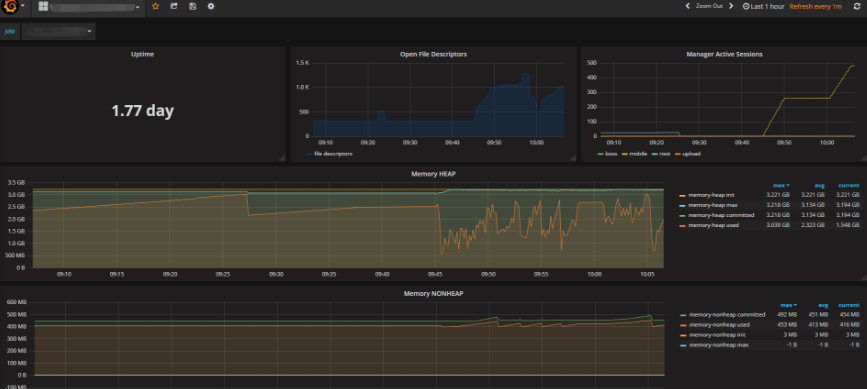
(4)然后就可以在grafana上看到tomcat的JVM监控了,大功告成!