Lesson outline
Pandas makes it very convenient to compute various statistics on a dataframe:
- Global statistics: mean, median, std, sum, etc. [more]
- Rolling statistics: rolling_mean, rolling_std, etc. [more]
You will use these functions to analyze stock movement over time.
Specifically, you will compute:
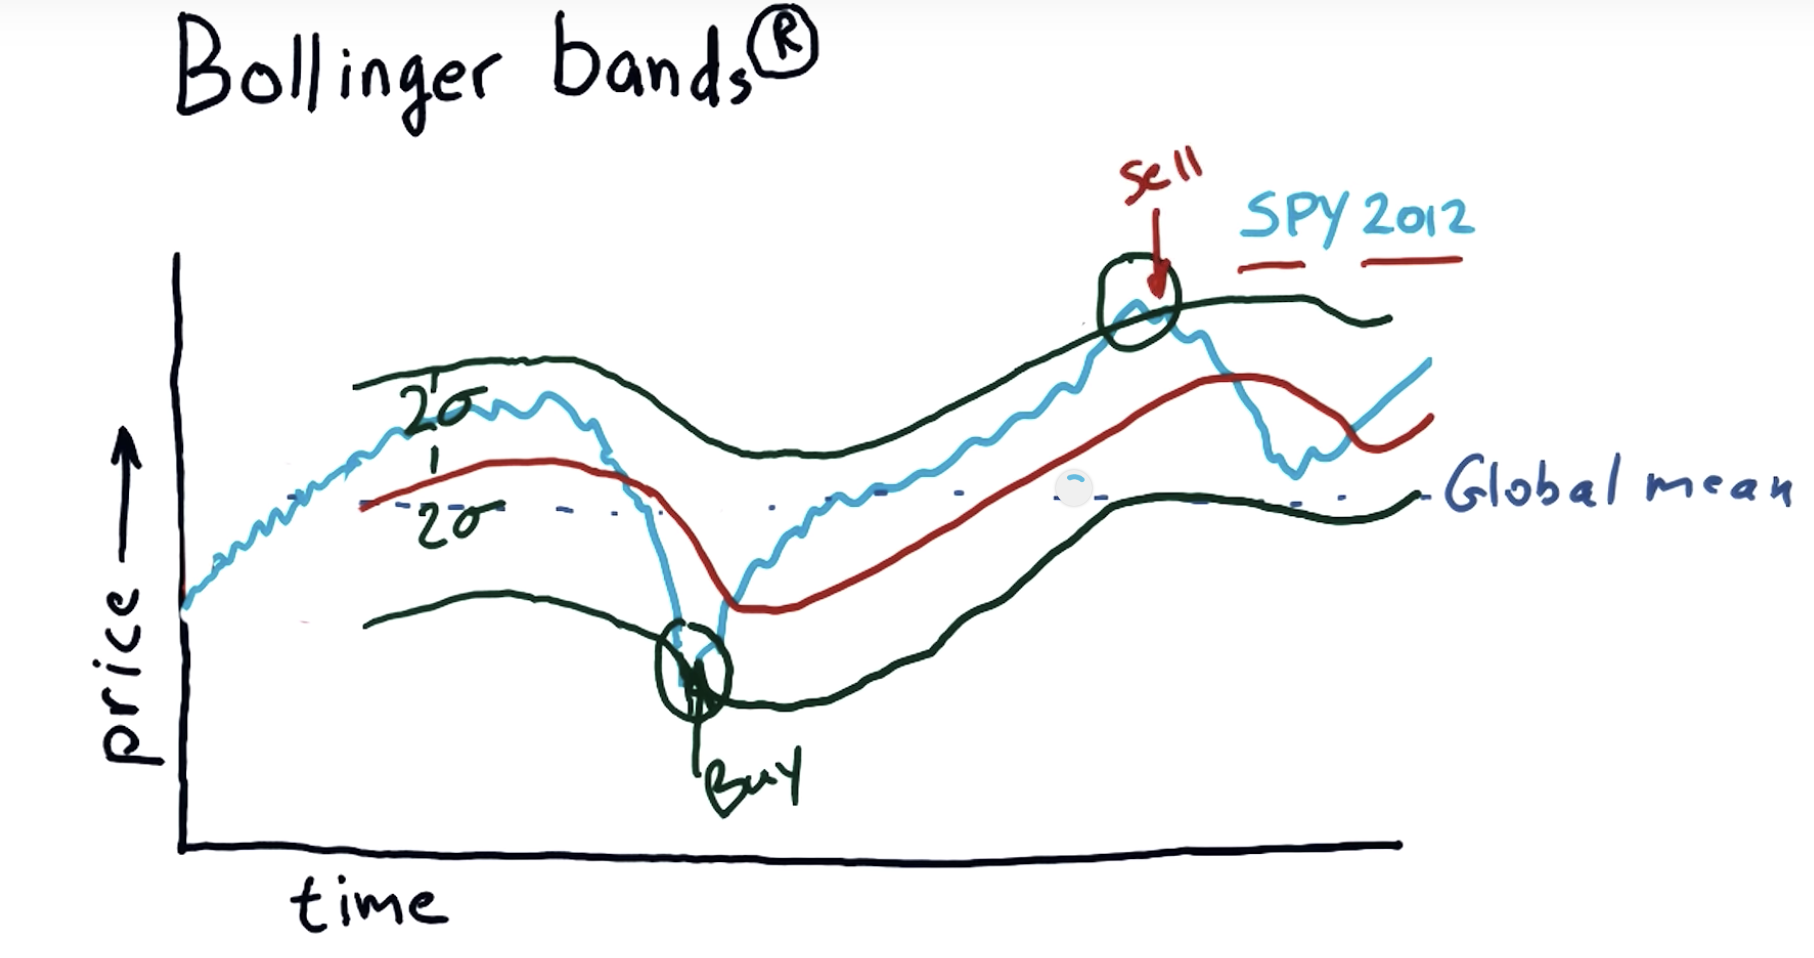
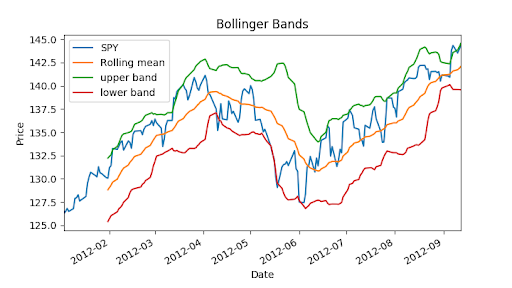
- Bollinger Bands: A way of quantifying how far stock price has deviated from some norm.
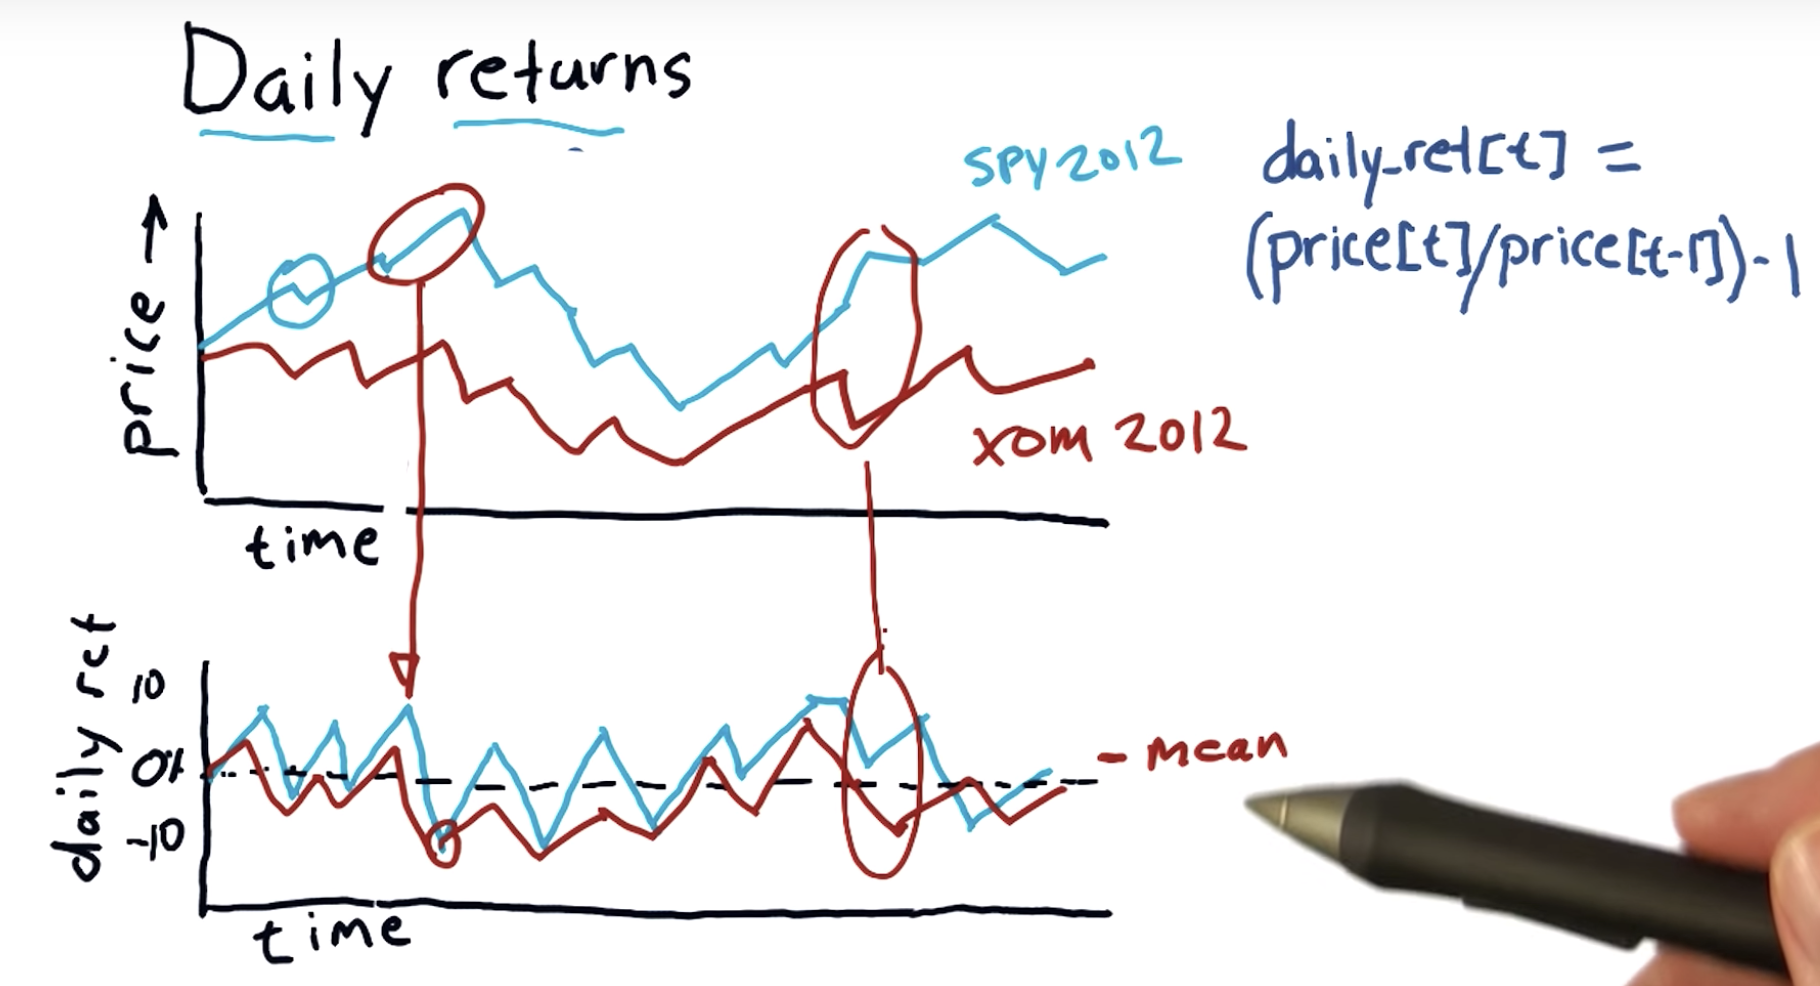
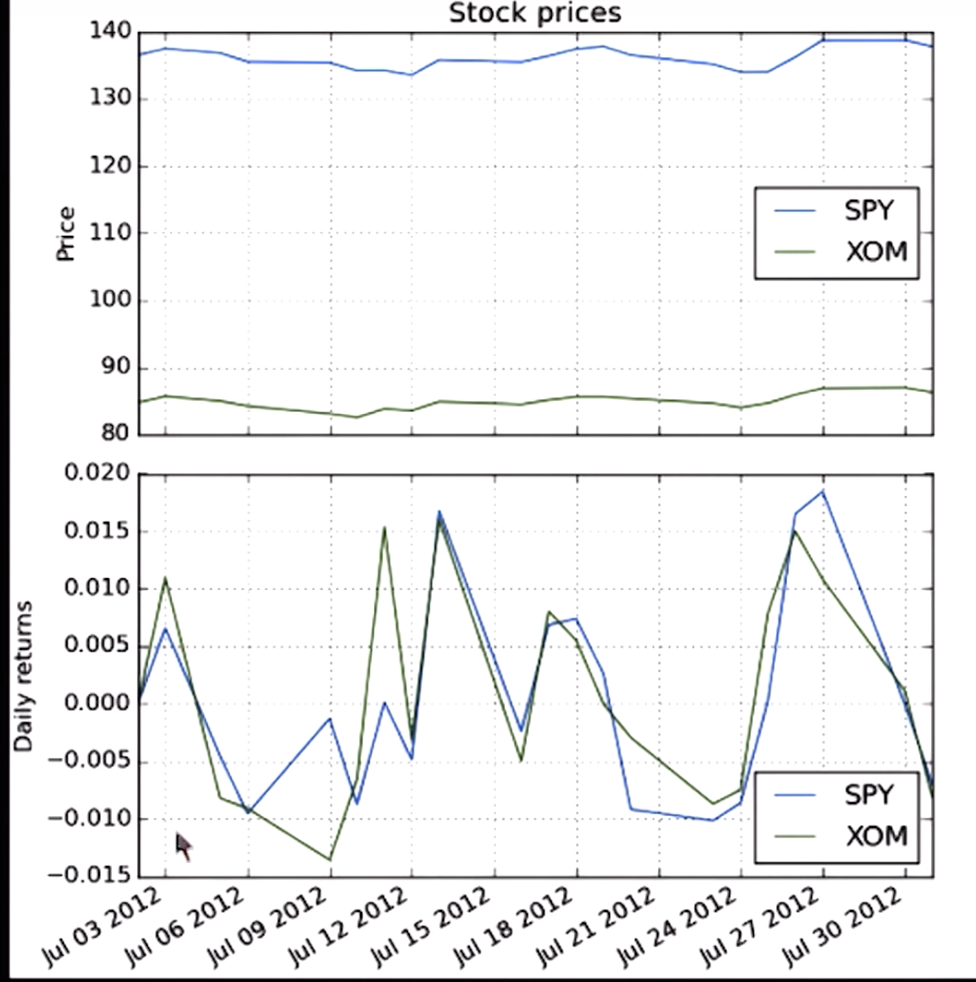
- Daily returns: Day-to-day change in stock price.
Global statistics
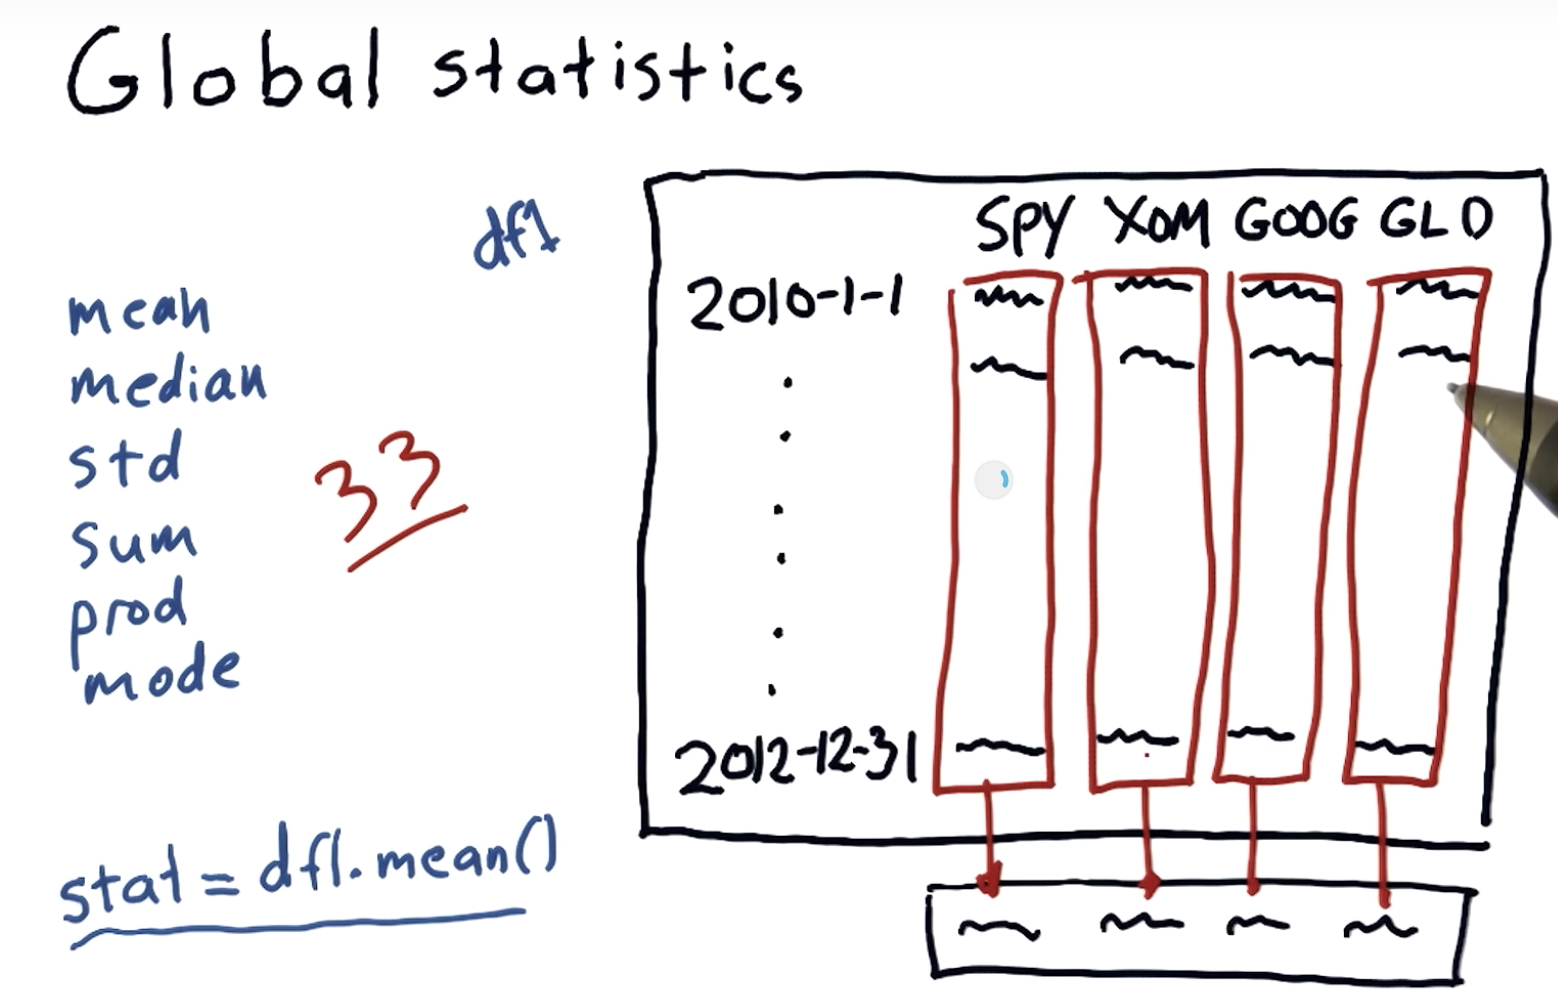
Global statistics: mean, median, std, sum, etc. [more]
Rolling statistics

rolling mean is one of the technical indicators,
one thing it looks at is the places where the proce crosses through the rolling average , eg:

a hypothesis is that this rolling mean may be a good representation of sort of the true underlying price of a stock
and that significant deviation from that eventually result in a return to the mean
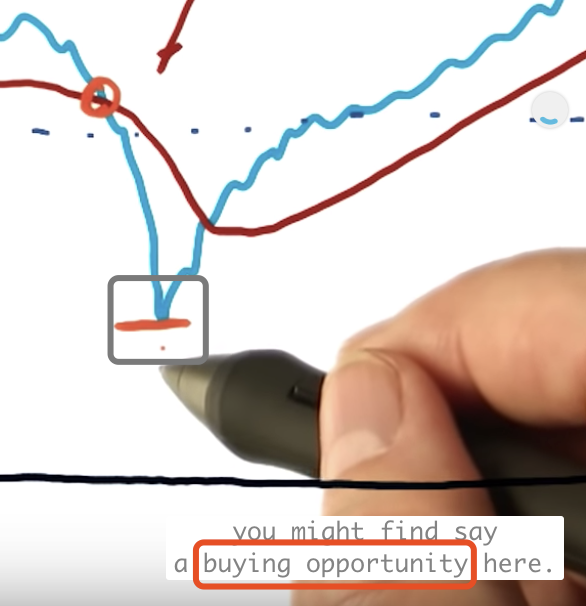
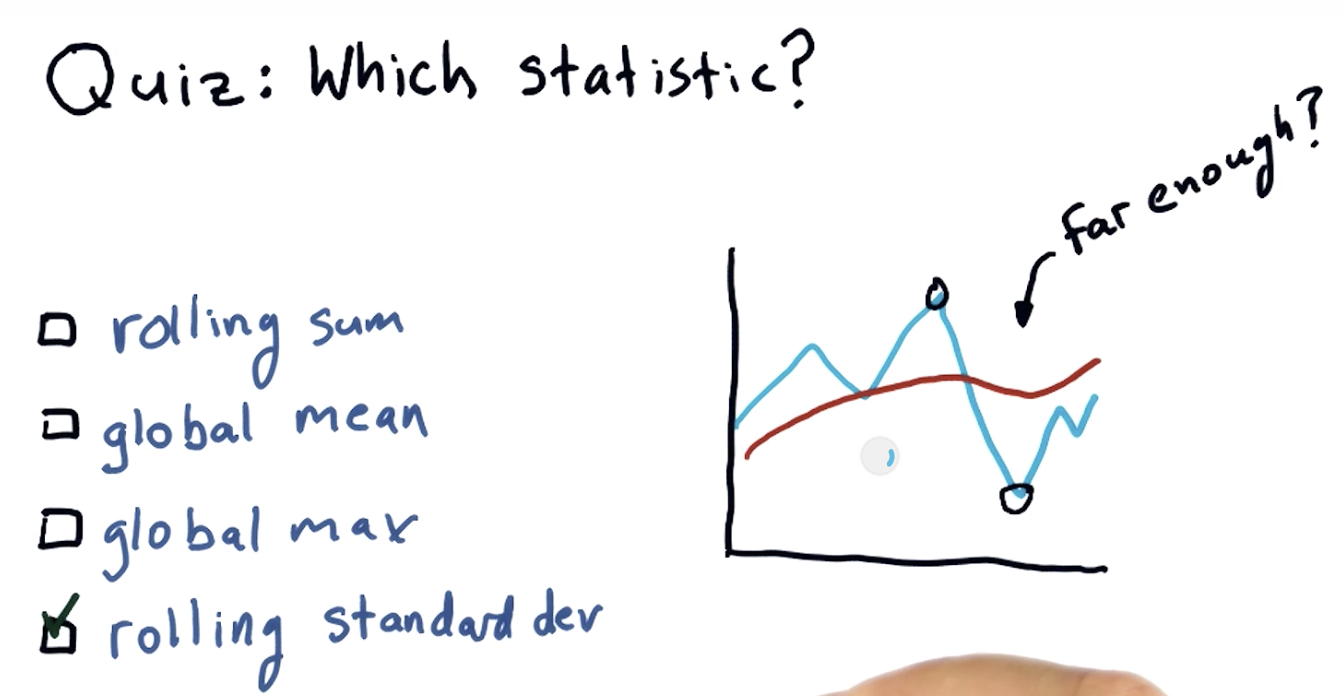
a challenge is when is that deviation significant enough: see the quiz and next slide
Which statistic to use?
Bollinger Bands (1980s)
Computing rolling statistics
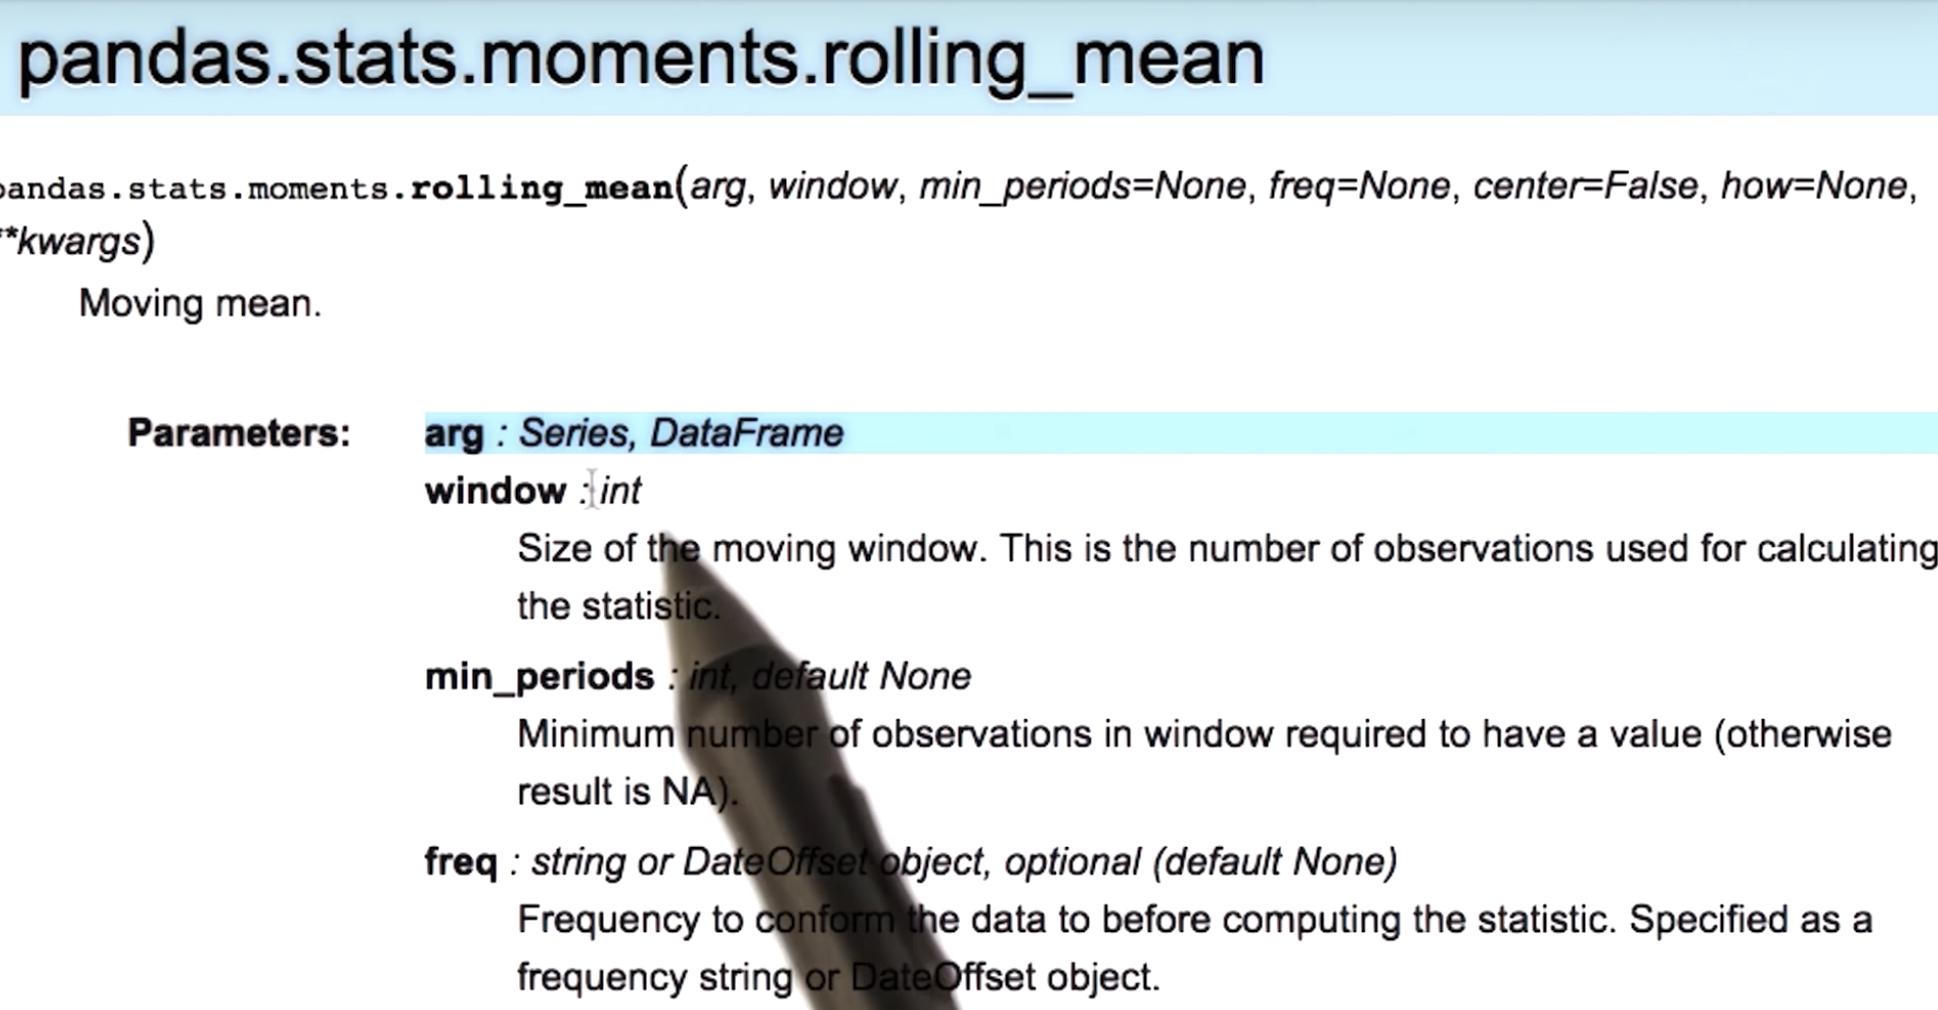
Rolling statistics: rolling_mean, rolling_std, etc. [more]
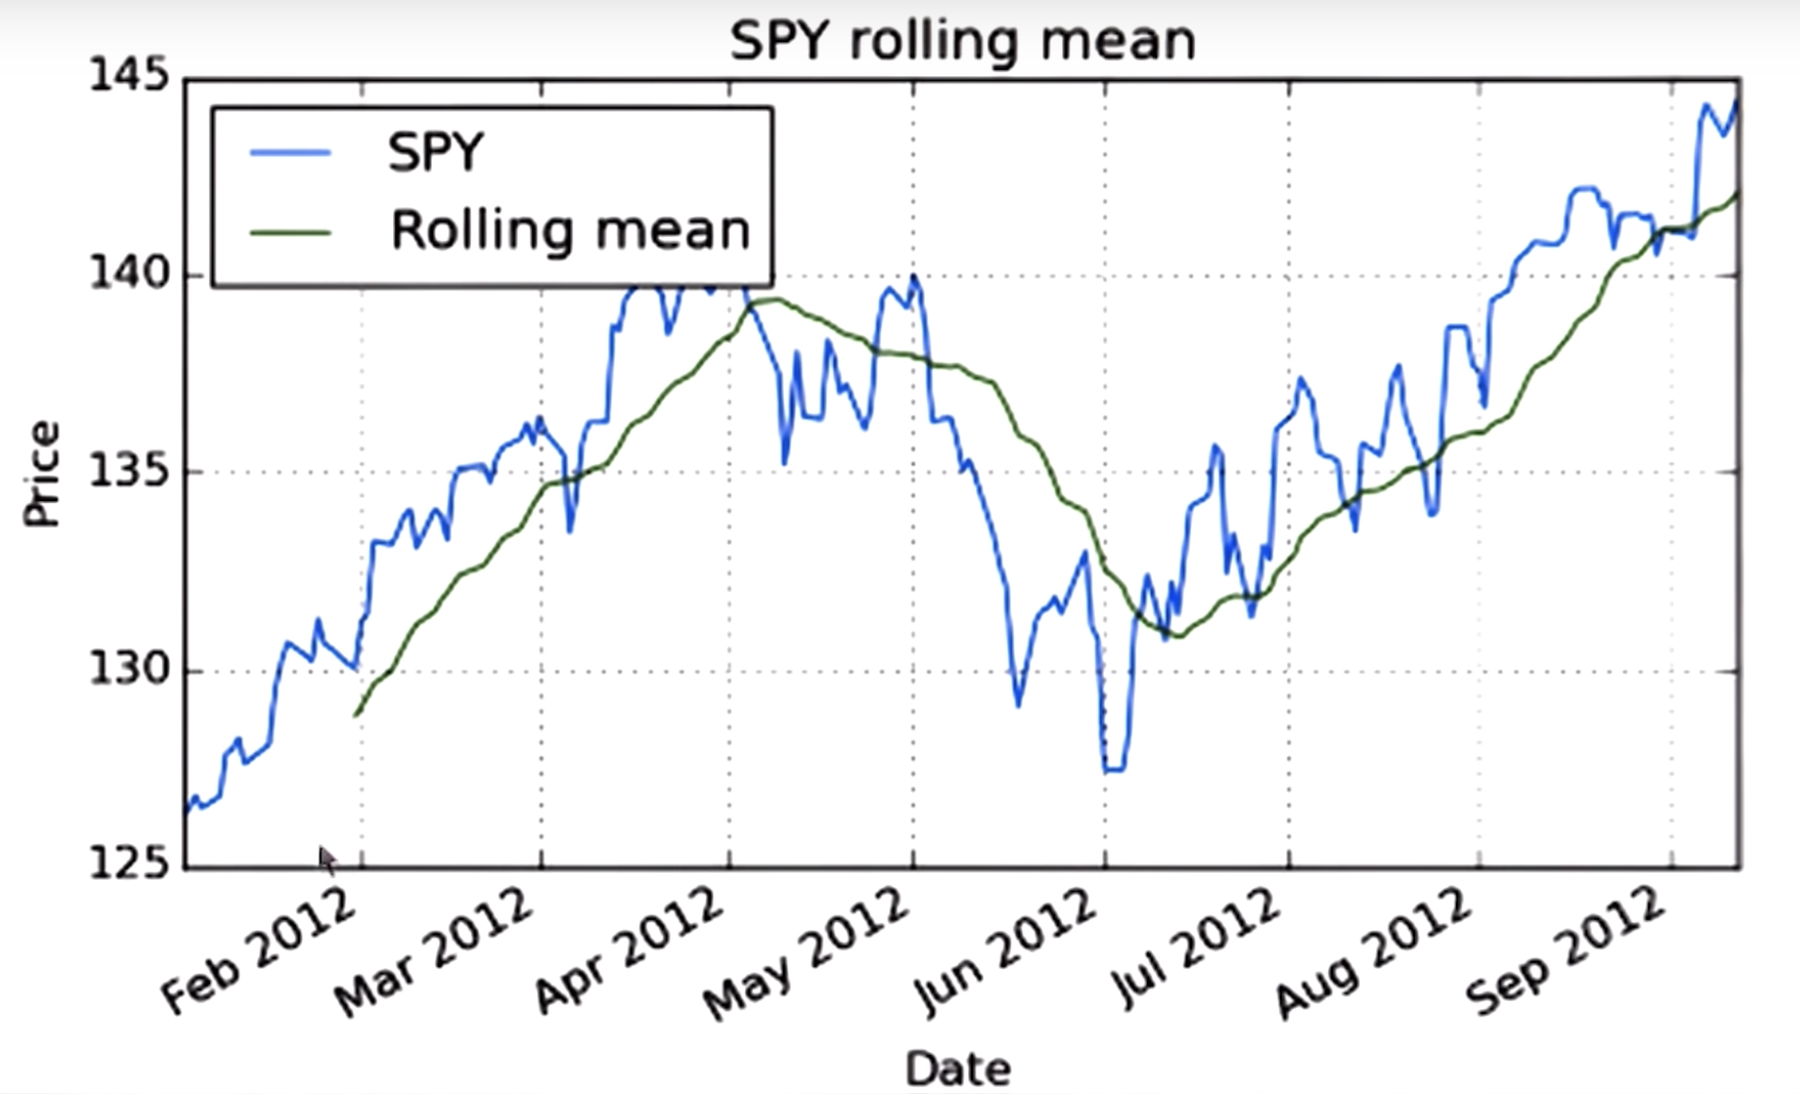
no data in the first 20 days
![]()
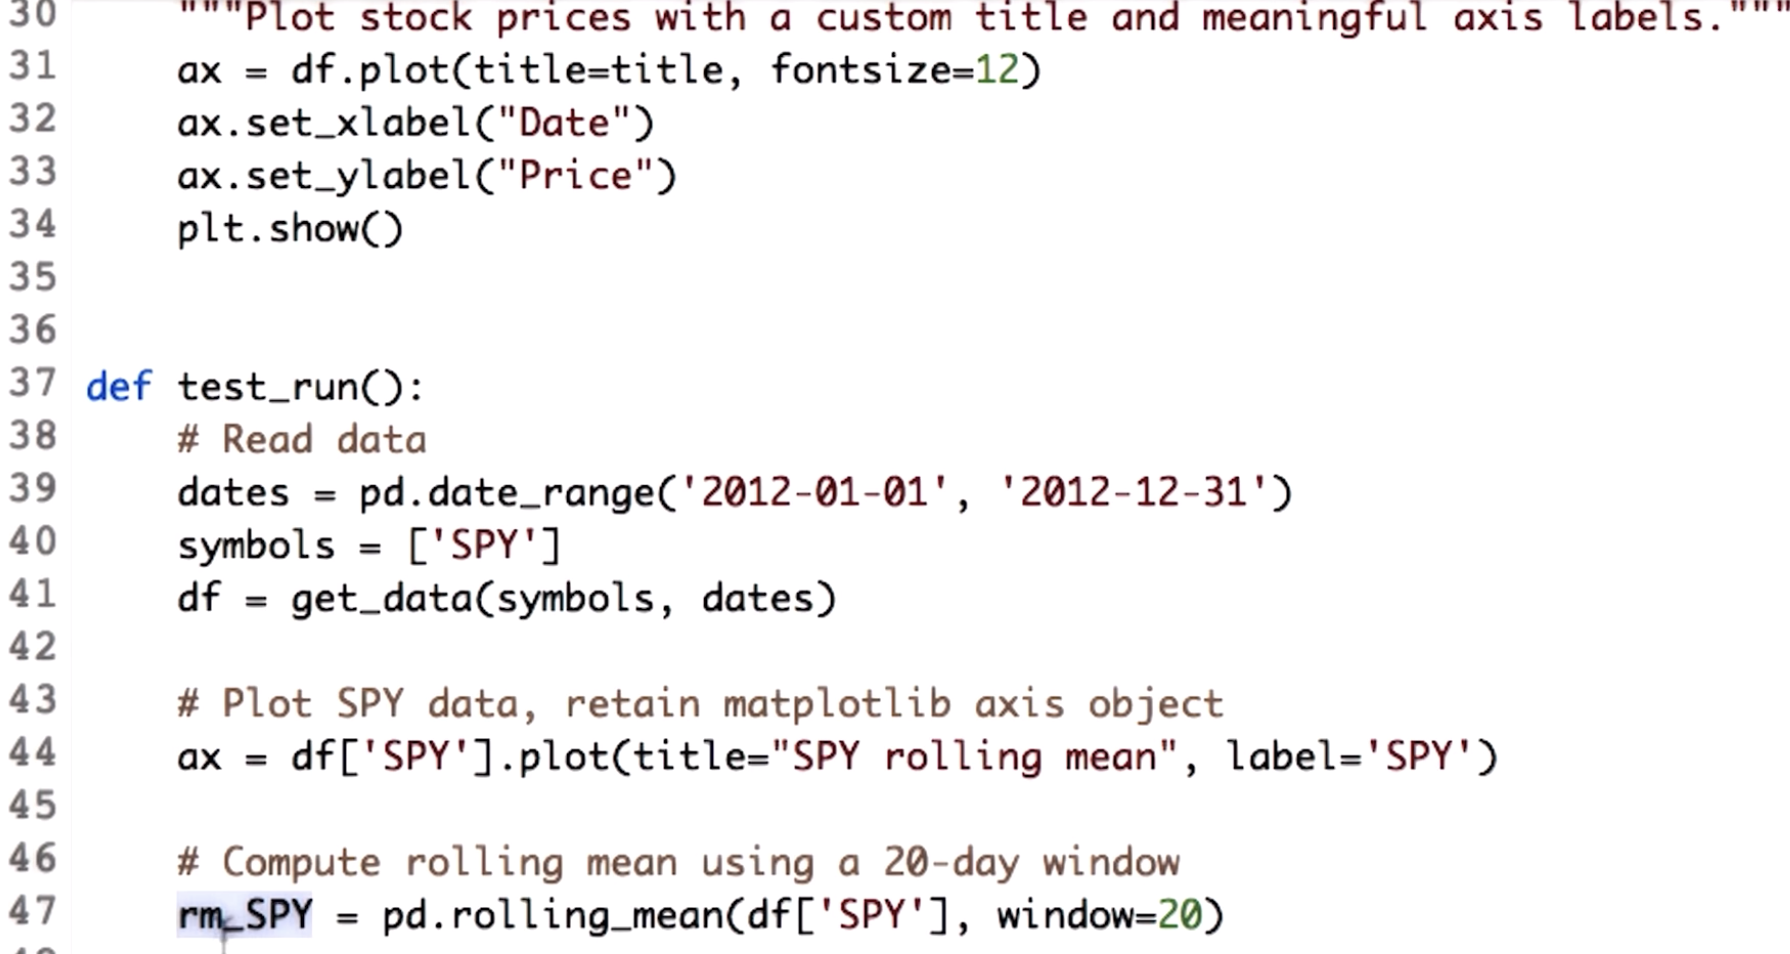
line 44 & 47
"""Bollinger Bands."""

import os
import pandas as pd
import matplotlib.pyplot as plt

def symbol_to_path(symbol, base_dir="data"):
    """Return CSV file path given ticker symbol."""
    return os.path.join(base_dir, "{}.csv".format(str(symbol)))


def get_data(symbols, dates):
    """Read stock data (adjusted close) for given symbols from CSV files."""
    df = pd.DataFrame(index=dates)
    if 'SPY' not in symbols:  # add SPY for reference, if absent
        symbols.insert(0, 'SPY')

    for symbol in symbols:
        df_temp = pd.read_csv(symbol_to_path(symbol), index_col='Date',
                parse_dates=True, usecols=['Date', 'Adj Close'], na_values=['nan'])
        df_temp = df_temp.rename(columns={'Adj Close': symbol})
        df = df.join(df_temp)
        if symbol == 'SPY':  # drop dates SPY did not trade
            df = df.dropna(subset=["SPY"])

    return df


def plot_data(df, title="Stock prices"):
    """Plot stock prices with a custom title and meaningful axis labels."""
    ax = df.plot(title=title, fontsize=12)
    ax.set_xlabel("Date")
    ax.set_ylabel("Price")
    plt.show()


def get_rolling_mean(values, window):
    """Return rolling mean of given values, using specified window size."""
    return pd.rolling_mean(values, window=window)


def get_rolling_std(values, window):
    """Return rolling standard deviation of given values, using specified window size."""
    # TODO: Compute and return rolling standard deviation
    return pd.rolling_std(values,window=window)


def get_bollinger_bands(rm, rstd):
    """Return upper and lower Bollinger Bands."""
    # TODO: Compute upper_band and lower_band
    upper_band = rm + 2*rstd
    lower_band = rm - 2*rstd
    return upper_band, lower_band


def test_run():
    # Read data
    dates = pd.date_range('2012-01-01', '2012-12-31')
    symbols = ['SPY']
    df = get_data(symbols, dates)

    # Compute Bollinger Bands
    # 1. Compute rolling mean
    rm_SPY = get_rolling_mean(df['SPY'], window=20)

    # 2. Compute rolling standard deviation
    rstd_SPY = get_rolling_std(df['SPY'], window=20)

    # 3. Compute upper and lower bands
    upper_band, lower_band = get_bollinger_bands(rm_SPY, rstd_SPY)

    # Plot raw SPY values, rolling mean and Bollinger Bands
    ax = df['SPY'].plot(title="Bollinger Bands", label='SPY')
    rm_SPY.plot(label='Rolling mean', ax=ax)
    upper_band.plot(label='upper band', ax=ax)
    lower_band.plot(label='lower band', ax=ax)
Daily returns
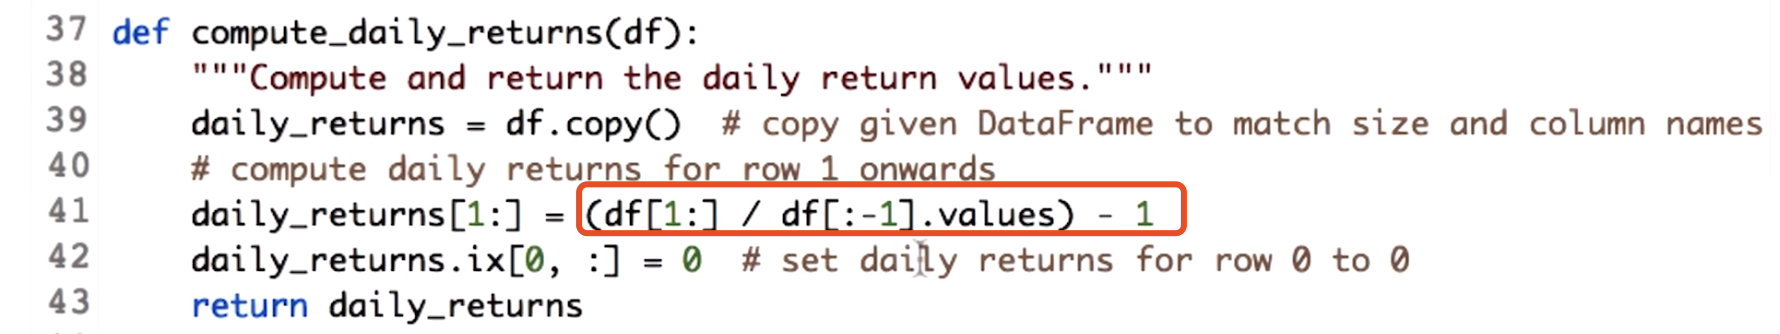
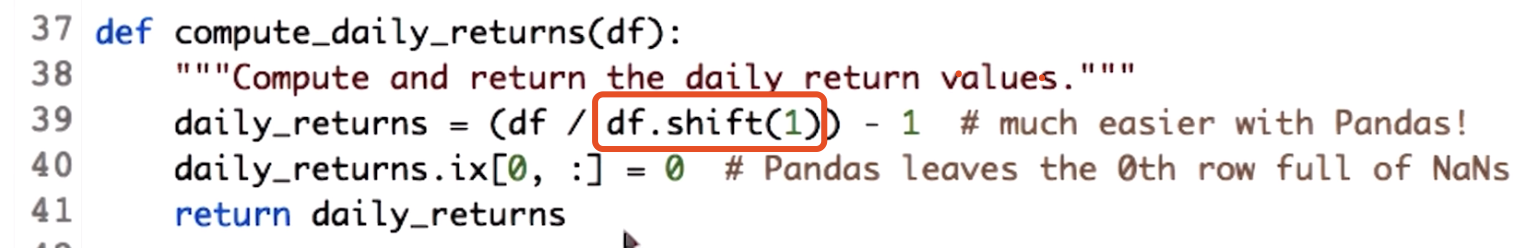
Compute daily returns
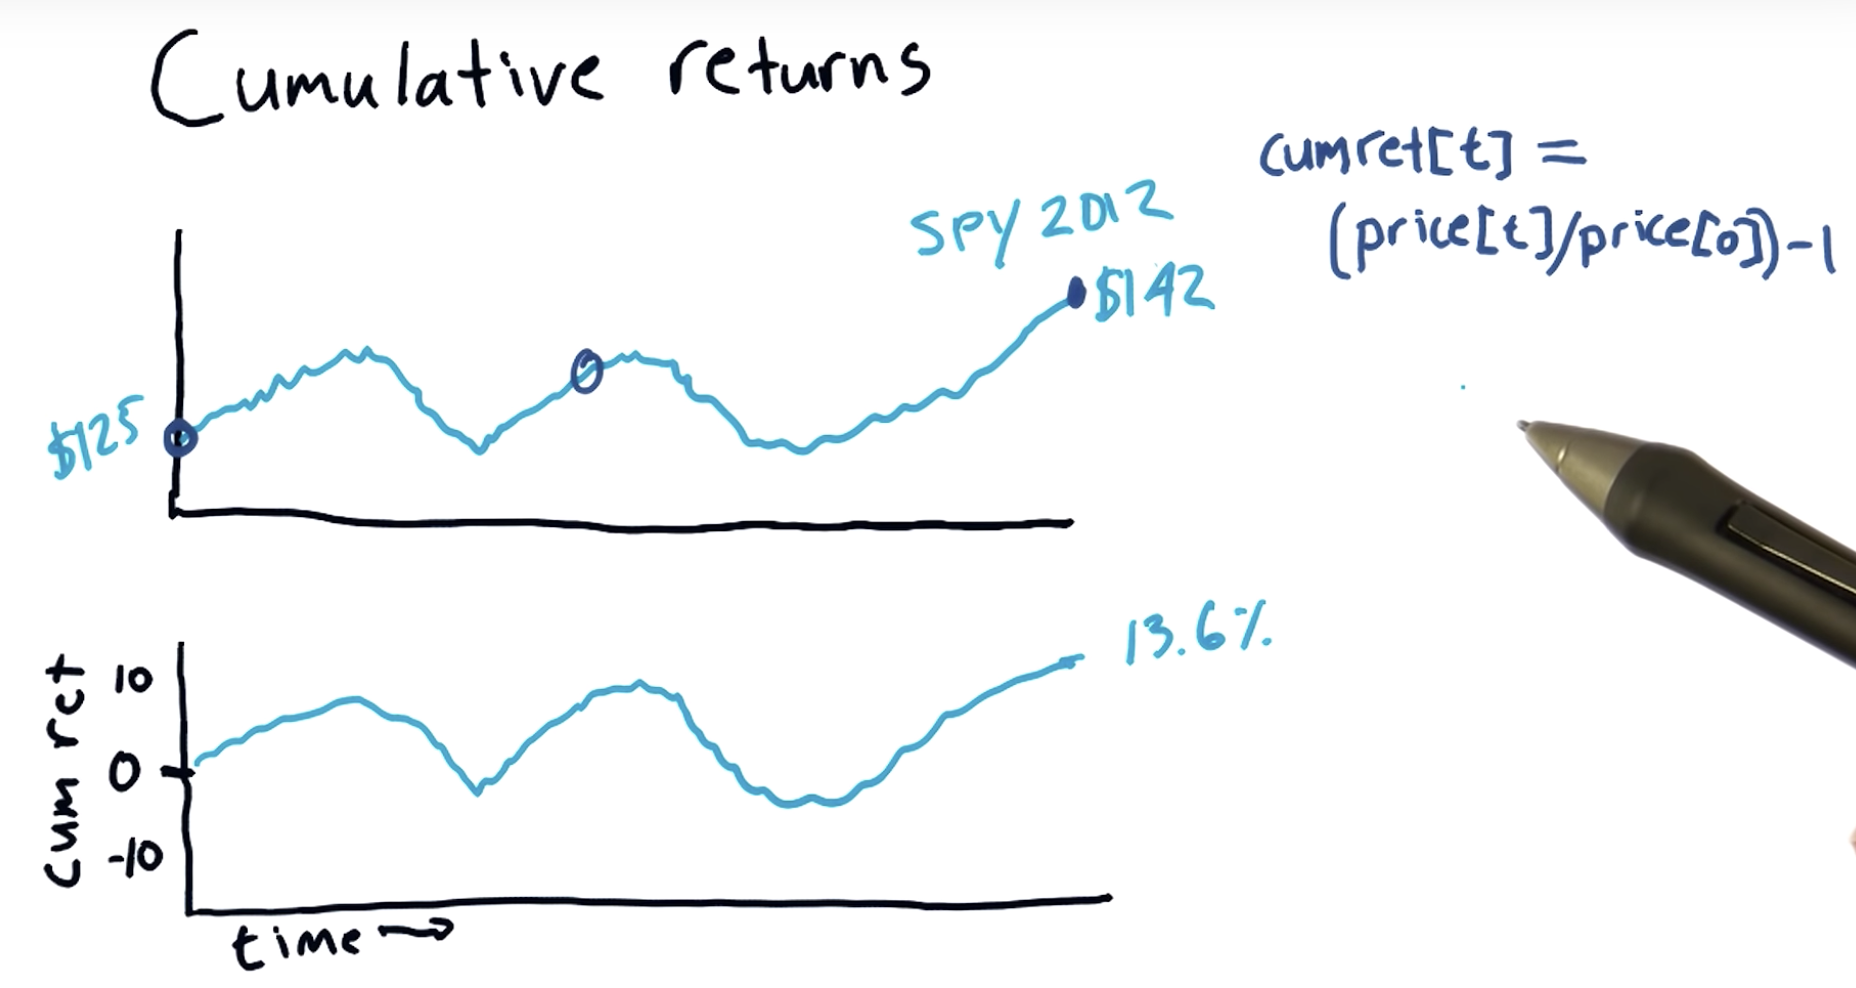
Cumulative returns
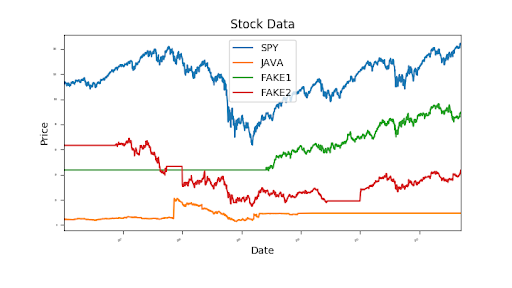
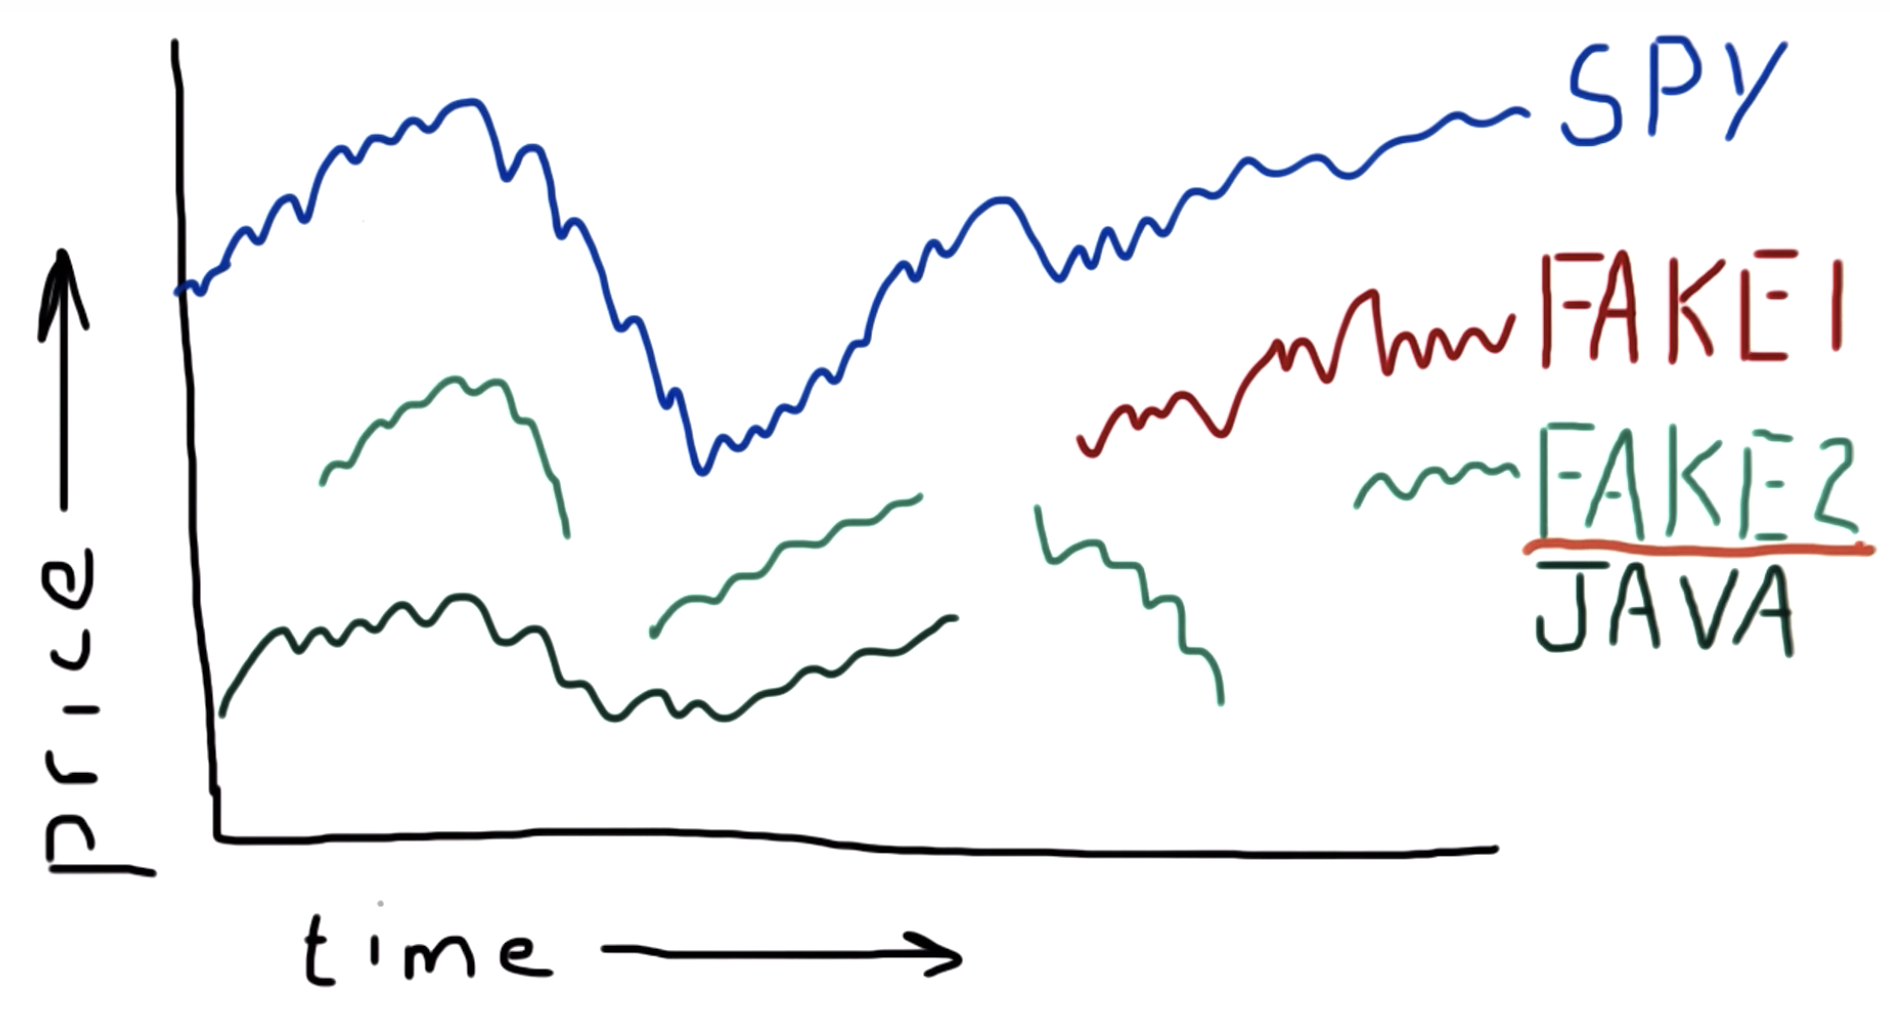
Pristine data

no exact correct price for a stock at a time point
Why data goes missing
An ETF or Exchange-Traded Fund is a basket of equities allocated in such a way that the overall portfolio tracks the performance of a stock exchange index. ETFs can be bought and sold on the market like shares.
For example, SPY tracks the S&P 500 index (Standard & Poor's selection of 500 large publicly-traded companies).
You will learn more about ETFs and other funds in the second mini-course.
case1: ends
case2: starts
case3: starts and ends occasionally
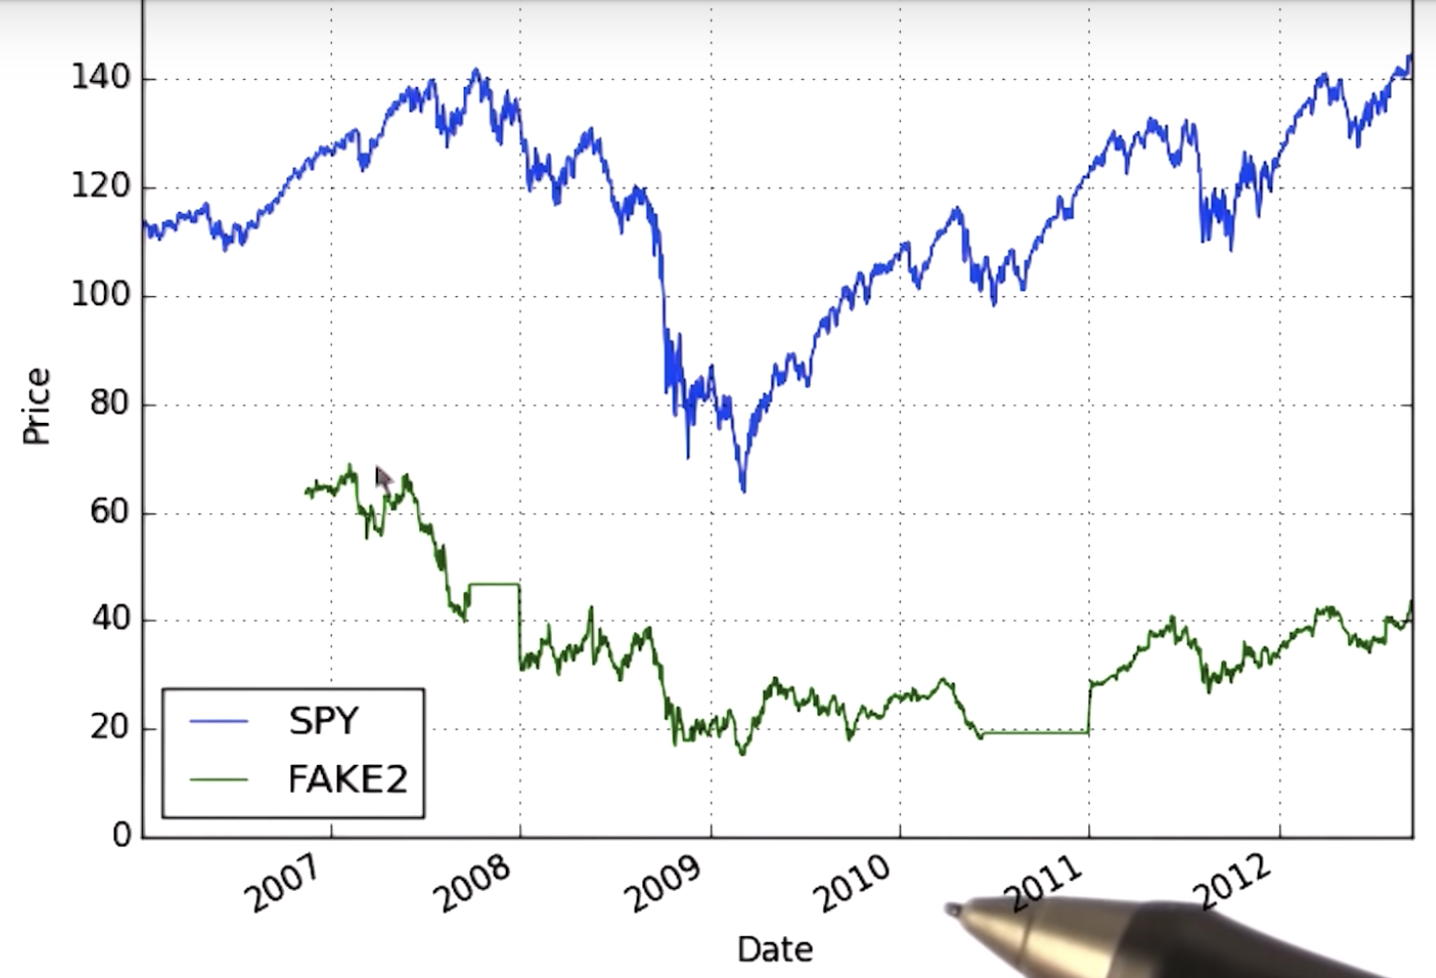
Why this is bad - what can we do?
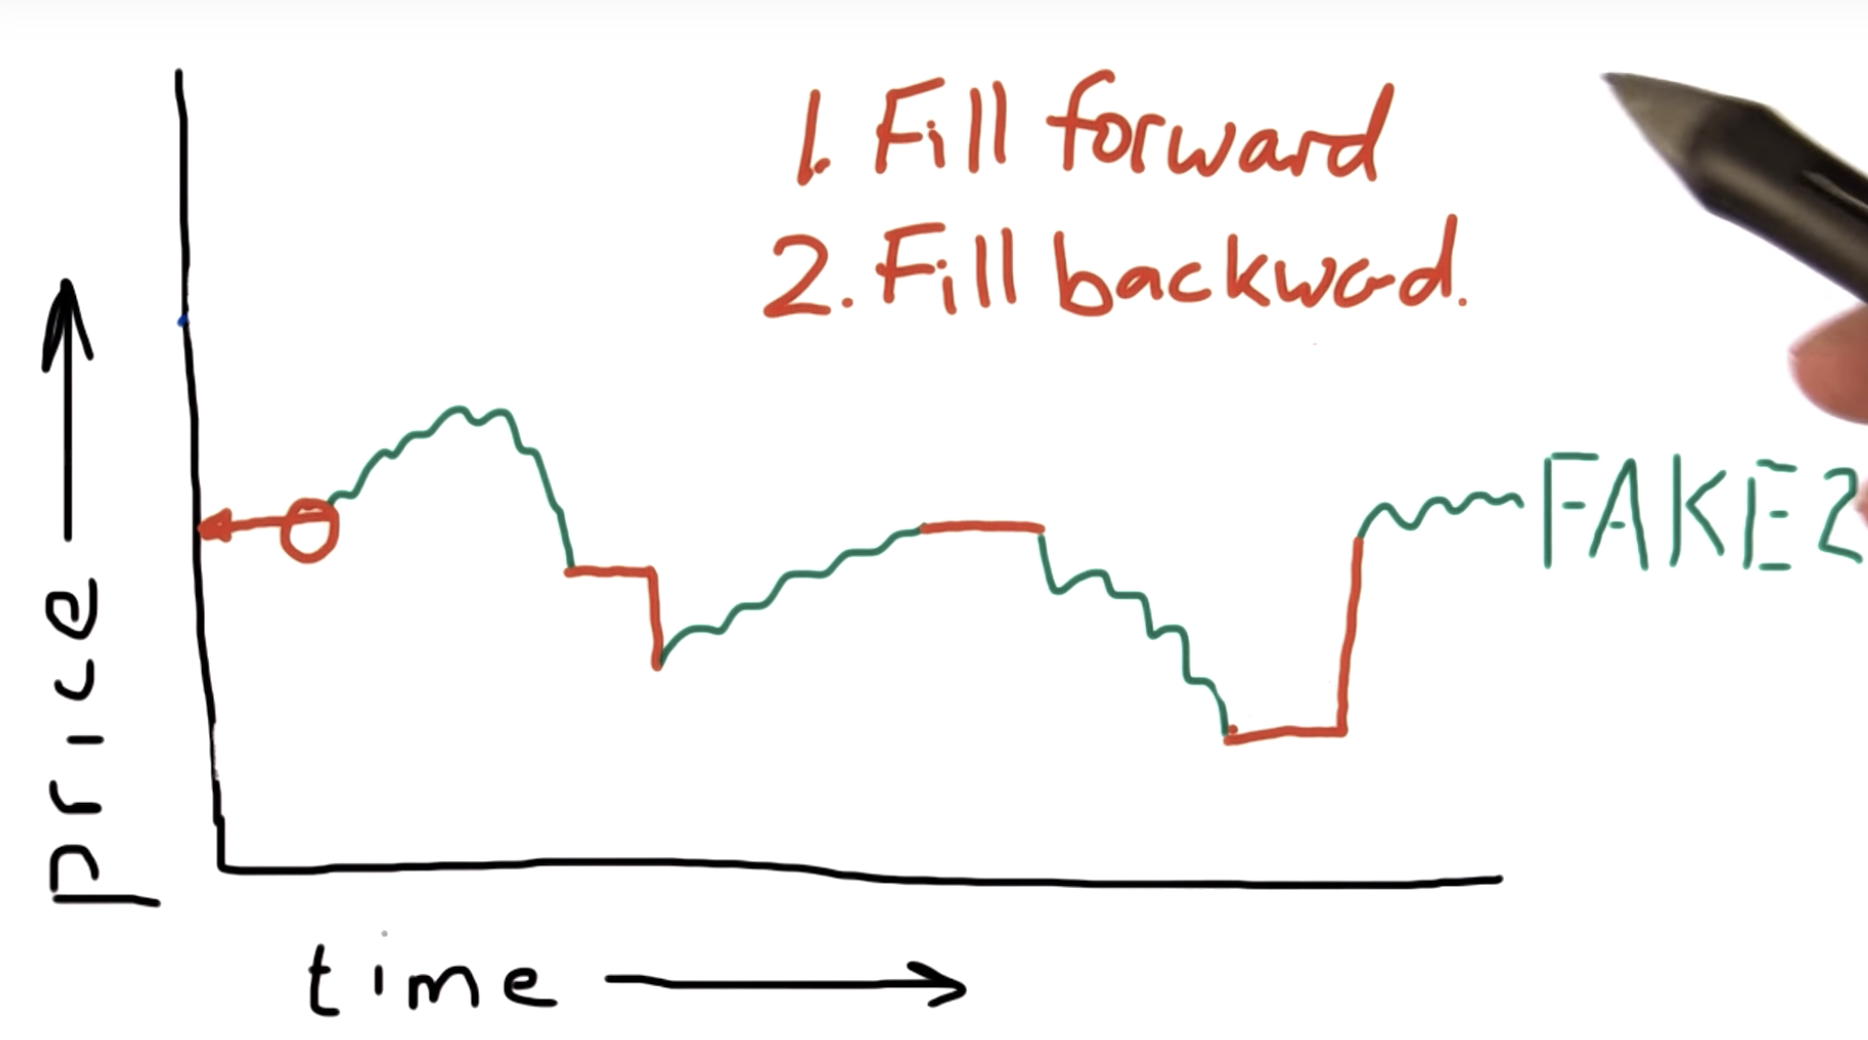
3, dont interpolate
Documentation: pandas
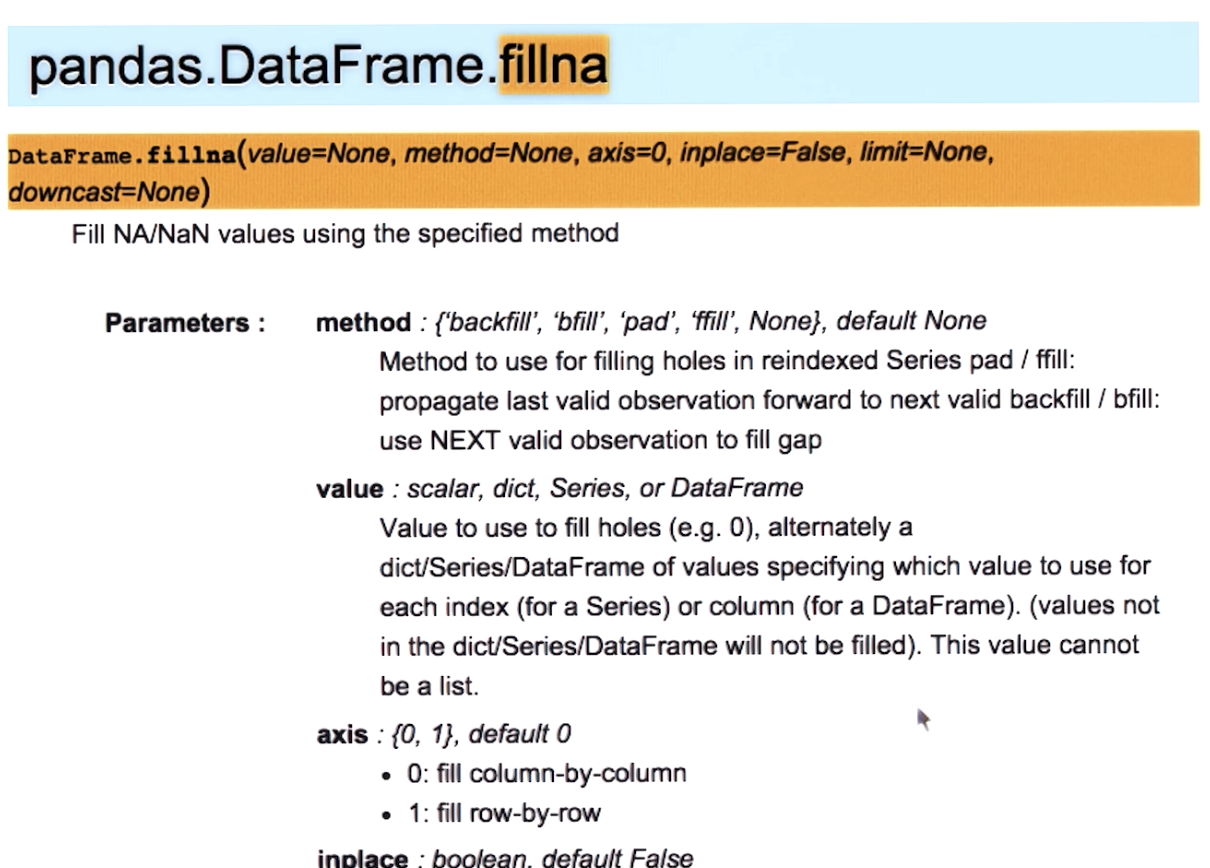
Documentation: pandas.DataFrame.fillna()
You could also use the 'pad' method, same as 'ffill': fillna(method='pad')

Using fillna()
Read about method, inplace and other parameters: pandas.DataFrame.fillna()
Correction: The inplace parameter accepts a boolean value (whereas method accepts a string), so the function call (in line 47) should look like:
df_data.fillna(method="ffill", inplace=True)
Boolean constants in Python are True and False (without quotes).
"""Fill missing values"""

import numpy as np
import pandas as pd
import matplotlib.pyplot as plt
import os

def fill_missing_values(df_data):
    """Fill missing values in data frame, in place."""
    df_data.fillna(method="ffill",inplace=True)
    return df_data.fillna(method="bfill",inplace=True)


def symbol_to_path(symbol, base_dir="data"):
    """Return CSV file path given ticker symbol."""
    return os.path.join(base_dir, "{}.csv".format(str(symbol)))


def get_data(symbols, dates):
    """Read stock data (adjusted close) for given symbols from CSV files."""
    df_final = pd.DataFrame(index=dates)
    if "SPY" not in symbols:  # add SPY for reference, if absent
        symbols.insert(0, "SPY")

    for symbol in symbols:
        file_path = symbol_to_path(symbol)
        df_temp = pd.read_csv(file_path, parse_dates=True, index_col="Date",
            usecols=["Date", "Adj Close"], na_values=["nan"])
        df_temp = df_temp.rename(columns={"Adj Close": symbol})
        df_final = df_final.join(df_temp)
        if symbol == "SPY":  # drop dates SPY did not trade
            df_final = df_final.dropna(subset=["SPY"])

    return df_final


def plot_data(df_data):
    """Plot stock data with appropriate axis labels."""
    ax = df_data.plot(title="Stock Data", fontsize=2)
    ax.set_xlabel("Date")
    ax.set_ylabel("Price")
    plt.show()


def test_run():
    """Function called by Test Run."""
    # Read data
    symbol_list = ["JAVA", "FAKE1", "FAKE2"]  # list of symbols
    start_date = "2005-12-31"
    end_date = "2014-12-07"
    dates = pd.date_range(start_date, end_date)  # date range as index
    df_data = get_data(symbol_list, dates)  # get data for each symbol

    # Fill missing values
    fill_missing_values(df_data)

    # Plot
    plot_data(df_data)


if __name__ == "__main__":
    test_run()