### 环境:python 3.7, 32位
运行结果:
[BernoulliRBM] Iteration 1, pseudo-likelihood = -25.39, time = 0.17s
[BernoulliRBM] Iteration 2, pseudo-likelihood = -23.77, time = 0.24s
[BernoulliRBM] Iteration 3, pseudo-likelihood = -22.94, time = 0.24s
[BernoulliRBM] Iteration 4, pseudo-likelihood = -21.91, time = 0.24s
[BernoulliRBM] Iteration 5, pseudo-likelihood = -21.69, time = 0.24s
[BernoulliRBM] Iteration 6, pseudo-likelihood = -21.06, time = 0.24s
[BernoulliRBM] Iteration 7, pseudo-likelihood = -20.89, time = 0.23s
[BernoulliRBM] Iteration 8, pseudo-likelihood = -20.64, time = 0.23s
[BernoulliRBM] Iteration 9, pseudo-likelihood = -20.36, time = 0.23s
[BernoulliRBM] Iteration 10, pseudo-likelihood = -20.09, time = 0.24s
Logistic regression using RBM features:
precision recall f1-score support
0 0.99 0.98 0.99 174
1 0.92 0.94 0.93 184
2 0.95 0.96 0.95 166
3 0.94 0.89 0.92 194
4 0.97 0.94 0.95 186
5 0.94 0.91 0.92 181
6 0.98 0.98 0.98 207
7 0.93 0.99 0.96 154
8 0.88 0.88 0.88 182
9 0.88 0.92 0.90 169
accuracy 0.94 1797
macro avg 0.94 0.94 0.94 1797
weighted avg 0.94 0.94 0.94 1797
Logistic regression using raw pixel features:
precision recall f1-score support
0 0.90 0.92 0.91 174
1 0.60 0.58 0.59 184
2 0.76 0.85 0.80 166
3 0.78 0.79 0.78 194
4 0.81 0.84 0.82 186
5 0.76 0.76 0.76 181
6 0.91 0.87 0.89 207
7 0.86 0.88 0.87 154
8 0.67 0.58 0.62 182
9 0.75 0.76 0.75 169
accuracy 0.78 1797
macro avg 0.78 0.78 0.78 1797
weighted avg 0.78 0.78 0.78 1797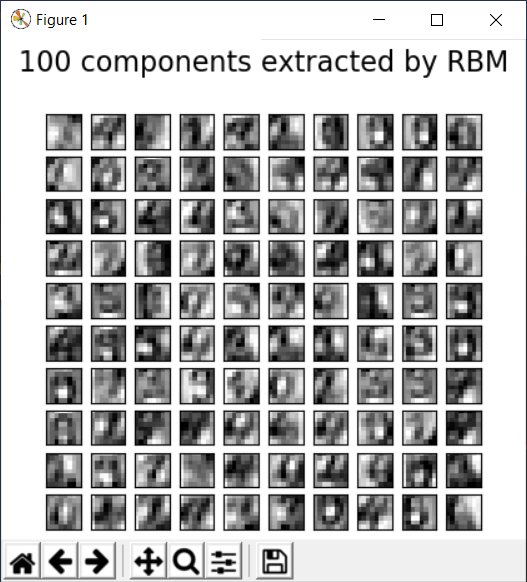
代码来源:
https://scikit-learn.org/dev/auto_examples/neural_networks/plot_rbm_logistic_classification.html
========================
print(__doc__)

# Authors: Yann N. Dauphin, Vlad Niculae, Gabriel Synnaeve
# License: BSD

import numpy as np
import matplotlib.pyplot as plt

from scipy.ndimage import convolve
from sklearn import linear_model, datasets, metrics
from sklearn.model_selection import train_test_split
from sklearn.neural_network import BernoulliRBM
from sklearn.pipeline import Pipeline
from sklearn.base import clone


# #############################################################################
# Setting up

def nudge_dataset(X, Y):
    """
    This produces a dataset 5 times bigger than the original one,
    by moving the 8x8 images in X around by 1px to left, right, down, up
    """
    direction_vectors = [
        [[0, 1, 0],
         [0, 0, 0],
         [0, 0, 0]],

        [[0, 0, 0],
         [1, 0, 0],
         [0, 0, 0]],

        [[0, 0, 0],
         [0, 0, 1],
         [0, 0, 0]],

        [[0, 0, 0],
         [0, 0, 0],
         [0, 1, 0]]]

    def shift(x, w):
        return convolve(x.reshape((8, 8)), mode='constant', weights=w).ravel()

    X = np.concatenate([X] +
                       [np.apply_along_axis(shift, 1, X, vector)
                        for vector in direction_vectors])
    Y = np.concatenate([Y for _ in range(5)], axis=0)
    return X, Y


# Load Data
X, y = datasets.load_digits(return_X_y=True)
X = np.asarray(X, 'float32')
X, Y = nudge_dataset(X, y)
X = (X - np.min(X, 0)) / (np.max(X, 0) + 0.0001)  # 0-1 scaling

X_train, X_test, Y_train, Y_test = train_test_split(
    X, Y, test_size=0.2, random_state=0)

# Models we will use
logistic = linear_model.LogisticRegression(solver='newton-cg', tol=1)
rbm = BernoulliRBM(random_state=0, verbose=True)

rbm_features_classifier = Pipeline(
    steps=[('rbm', rbm), ('logistic', logistic)])

# #############################################################################
# Training

# Hyper-parameters. These were set by cross-validation,
# using a GridSearchCV. Here we are not performing cross-validation to
# save time.
rbm.learning_rate = 0.06
rbm.n_iter = 10
# More components tend to give better prediction performance, but larger
# fitting time
rbm.n_components = 100
logistic.C = 6000

# Training RBM-Logistic Pipeline
rbm_features_classifier.fit(X_train, Y_train)

# Training the Logistic regression classifier directly on the pixel
raw_pixel_classifier = clone(logistic)
raw_pixel_classifier.C = 100.
raw_pixel_classifier.fit(X_train, Y_train)

# #############################################################################
# Evaluation

Y_pred = rbm_features_classifier.predict(X_test)
print("Logistic regression using RBM features:
%s
" % (
    metrics.classification_report(Y_test, Y_pred)))

Y_pred = raw_pixel_classifier.predict(X_test)
print("Logistic regression using raw pixel features:
%s
" % (
    metrics.classification_report(Y_test, Y_pred)))

# #############################################################################
# Plotting

plt.figure(figsize=(4.2, 4))
for i, comp in enumerate(rbm.components_):
    plt.subplot(10, 10, i + 1)
    plt.imshow(comp.reshape((8, 8)), cmap=plt.cm.gray_r,
               interpolation='nearest')
    plt.xticks(())
    plt.yticks(())
plt.suptitle('100 components extracted by RBM', fontsize=16)
plt.subplots_adjust(0.08, 0.02, 0.92, 0.85, 0.08, 0.23)

plt.show()