现在的商场管理者在管理商场的同时面临着一些无法避免的问题比如:人员监管不到位、效率低下、商场同质化严重,人流量少等。发现了这些问题作为开发人员的我们怎能视而不见,我们的责任就是发现问题解决问题,提供更好更智能的服务。因此就此问题我们想出了相应的解决办法,使用JS+Three.js+Echart开发了一个功能界面,为商场管理者提供更加高效的管理方法。
通过商场管理系统的相应界面,商场管理者可实时获取商场的人流数据、人流密度的热力分布、可实时查看商场各处的视频监控信息、安保人员的实时位置信息及运动轨迹。针对突发状况可以即时调度、快速处理。还可以依据大数据分析周边业态情况,为制定运营策略提供数据支持等。
就以上的市场实际情况需求,开始了我的功能开发之旅。
我使用ESMap的地图编辑器编辑好商场地图后,开始布局规划解决问题
开发流程如下:
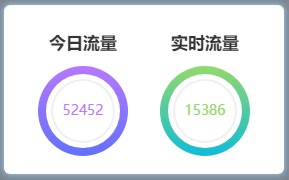
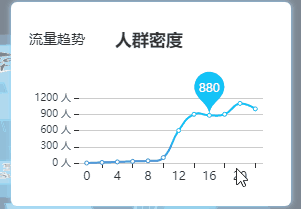
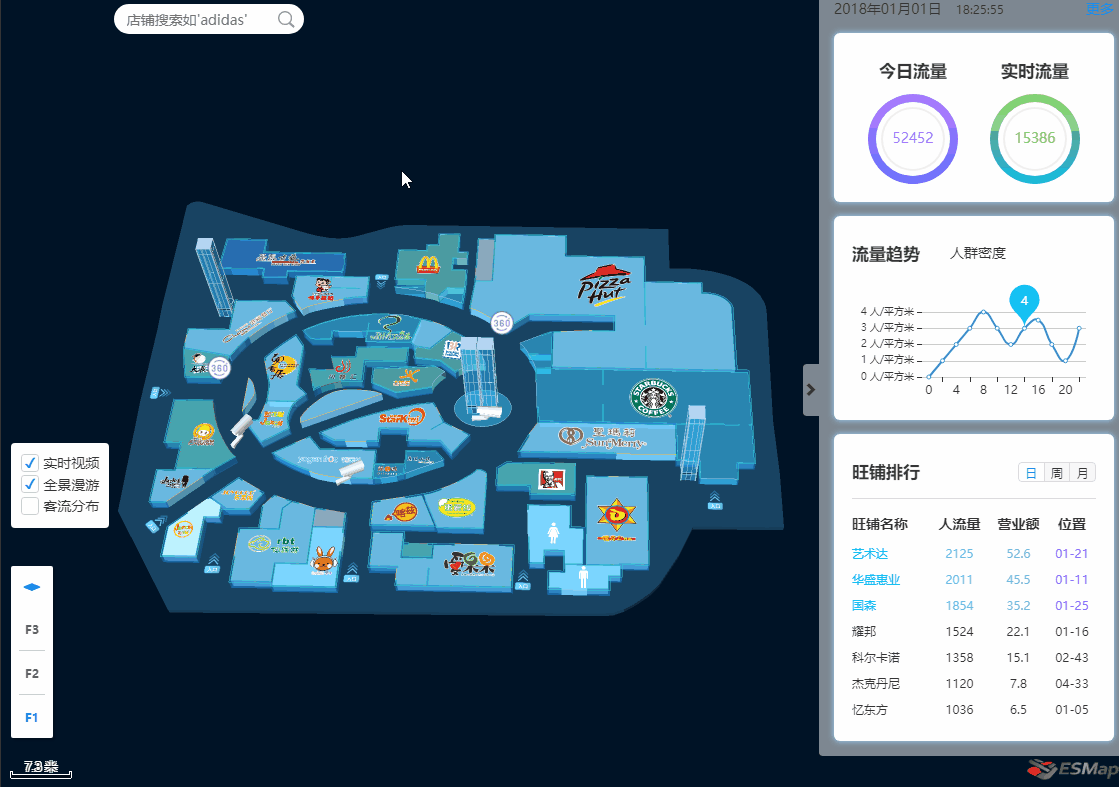
首先,实现一个商场客流量信息的饼状统计表,还有各个时间点的流量趋势和人群密度的线性图表。再实现一个控制面板,可以通过控制面板根据地图的热力图查看商场各个位置客流量以及各个位置的实时视频等,情况一目了然;最后做一个可以搜索店铺客流量及营业额情况的搜索框。
1.方便开发,先使用模拟数据创建图表,投入使用后自行接入后台数据即可。
(1)使用Echart创建统计客流量的饼状图:
function circleSet() {
        myChart1 = echarts.init(document.getElementById('ec1'));
        myChart2 = echarts.init(document.getElementById('ec2'));
        var color= ['#b679fe', '#6271fd','#94d96c', '#0fbdd9','#f0f0f0'];
        var dataStyle = {
            normal: {
                label: {
                    show: false
                },
                labelLine: {
                    show: false
                },
                shadowBlur: 40,
                borderWidth: 10,
                shadowColor: 'rgba(0, 0, 0, 0)' //边框阴影
            }
        };
        //第一个饼状图
        var optionCircleA = {
            backgroundColor: '#fff',
            title: {
                text: '52452',
                x: 'center',
                y: 'center',
                textStyle: {
                    fontWeight: 'normal',
                    fontSize: 14,
                    color: "#b679fe",
                }
            },
            series: [{
                    name: 'Line 1',
                    type: 'pie',
                    clockWise: false,
                    radius: [37, 45],
                    center:['50%','50%'],
                    itemStyle: dataStyle,
                    hoverAnimation: false,
                    startAngle: 90,
                    label:{
                        borderRadius:'10',
                    },
                    data: [{
                            value: 54.6,
                            name: '外',
                            itemStyle: {
                                normal: {
                                    color: new echarts.graphic.LinearGradient(0, 0, 0, 1, [{
                                        offset: 0,
                                        color:color[0]
                                    }, {
                                        offset: 1,
                                        color: color[1]
                                    }])
                                }
                            }
                        },
                        {
                            value: 0,
                            name: '',
                            tooltip: {
                                show: false
                            },
                        },
                    ]
                },
                {
                    name: 'Line 2',
                    type: 'pie',
                    clockWise: false,
                    radius: [30, 32],
                    center:['50%','50%'],
                    itemStyle: dataStyle,
                    hoverAnimation: false,
                    startAngle: 90,
                    data: [{
                            value: 56.7,
                            name: '内',
                            itemStyle: {
                                normal: {
                                    color: new echarts.graphic.LinearGradient(0, 0, 0, 1, [{
                                        offset: 0,
                                        color: color[4]
                                    }, {
                                        offset: 1,
                                        color: color[4]
                                    }])
                                }
                            }
                        },
                        {
                            value: 0,
                            name: '',
                            tooltip: {
                                show: false
                            },
                        },
                    ]
                },
            ]
        };
    //第二个饼状图
        var optionCircleB = {
            backgroundColor: '#fff',
            title: {
                text: '15386',
                x: 'center',
                y: 'center',
                textStyle: {
                    fontWeight: 'normal',
                    fontSize: 14,
                    color: "#94d96c",
                }
            },
            series: [{
                    name: 'Line 1',
                    type: 'pie',
                    clockWise: false,
                    radius: [37, 45],
                    center:['50%','50%'],
                    itemStyle: dataStyle,
                    hoverAnimation: false,
                    startAngle: 90,
                    label:{
                        borderRadius:'10',
                    },
                    data: [{
                            value: 54.6,
                            name: '外',
                            itemStyle: {
                                normal: {
                                    color: new echarts.graphic.LinearGradient(0, 0, 0, 1, [{
                                        offset: 0,
                                        color:color[2]
                                    }, {
                                        offset: 1,
                                        color: color[3]
                                    }])
                                }
                            }
                        },
                        {
                            value: 0,
                            name: '',
                            tooltip: {
                                show: false
                            },
                        },
                    ]
                },
                {
                    name: 'Line 2',
                    type: 'pie',
                    clockWise: false,
                    radius: [30, 32],
                    center:['50%','50%'],
                    itemStyle: dataStyle,
                    hoverAnimation: false,
                    startAngle: 90,
                    data: [{
                            value: 56.7,
                            name: '内',
                            itemStyle: {
                                normal: {
                                    color: new echarts.graphic.LinearGradient(0, 0, 0, 1, [{
                                        offset: 0,
                                        color: color[4]
                                    }, {
                                        offset: 1,
                                        color: color[4]
                                    }])
                                }
                            }
                        },
                        {
                            value: 0,
                            name: '',
                            tooltip: {
                                show: false
                            },
                        },
                    ]
                },
            ]
        };
        myChart1.setOption(optionCircleA);
        myChart2.setOption(optionCircleB);
    }
效果如下图:
(2)使用echart创建人群密度线性图表,封装在函数lineSetA()内:
    //人群密度线性图表
    function lineSetA() {
        myChart3 = echarts.init(document.getElementById('ec3'));
        var colors = ['#12c3f8', '#4384d7'];
        optionLineA = {
            color: colors,
            visualMap: [{
                show: false,
                type: 'continuous',
                seriesIndex: 0,
                min: 0,
                max: 600,
                borderWidth: 3,
                color: colors,
            }],
            xAxis: {
                type: 'category',
                data: ['0', '2', '4', '6', '8', '10', '12', '14', '16', '18', '20', '22'],
                show: true,
                position: {
                  bottom: 10,
                  show: false,
                },
                onZero: false,
                axisLine: {
                    lineStyle: {
                         0,
                    }
                }
            },
            yAxis: {
                type: 'value',
                axisLabel: {
                    formatter: '{value} 人',
                    fontSize: 10,
                },
                axisLine: {
                    lineStyle: {
                         0,
                    }
                },
                minInterval: 300,
            },
            grid: [{
                top: '40',
                bottom: '25',
                left: '50',
                right: '10'
            }],
            series: [{
                data: [ 0, 10, 20, 30, 40, 100, 600, 900, 880, 900, 1100, 1000],
                type: 'line',
                smooth: true,
                markPoint: {
                    data: [
                        {
                            name: '880',
                            coord: ['16','880'],
                            value: '880',
                    ],
                    label: {
                        show: true,
                    },
                }
            }]
        };
        myChart3.setOption(optionLineA);
    }
创建流量趋势线性图表,封装在函数lineSetB()内:
//流量趋势线性图表
    function lineSetB() {
        myChart4 = echarts.init(document.getElementById('ec3'));
        var colors = ['#12c3f8', '#4384d7'];
        var optionLineB = {
            color: colors,
            visualMap: [{
                show: false,
                type: 'continuous',
                seriesIndex: 0,
                min: 0,
                max: 600,
                borderWidth: 3,
                color: colors,
            }],
            xAxis: {
                type: 'category',
                data: ['0', '2', '4', '6', '8', '10', '12', '14', '16', '18', '20', '22'],
                show: true,
                position: {
                  bottom: 10,
                  show: false,
                },
                onZero: false,
                axisLine: {
                    lineStyle: {
                         0,
                    }
                }
            },
            yAxis: {
                type: 'value',
                axisLabel: {
                    formatter: '{value} 人/平方米',
                    fontSize: 10,
                },
                axisLine: {
                    lineStyle: {
                         0,
                    }
                },
                minInterval: 0.5,
            },
            grid: [{
                top: '40',
                bottom: '25',
                left: '70',
                right: '10'
            }],
            series: [{
                data: [ 0, 1, 2, 3, 4, 3, 2, 3, 3.5, 2, 1, 3],
                type: 'line',
                smooth: true,
                markPoint: {
                    data: [
                        {
                            name: '4',
                            coord: ['14','3'],
                            value: '4',
                        }
                    ],
                    label: {
                        show: true,
                    },
                }
            }]
        };
        myChart4.setOption(optionLineB);
    }
切换线性图表数据显示实现:
    //切换线性图表数据显示
    $(".list-b .title-box .t-a").click(function() {//点击流量趋势
        $(".list-b .title-box .t-b").removeClass('active');//移除当前样式
        $(this).addClass('active');//给点击添加新样式
        resizeLineA();
    })
    $(".list-b .title-box .t-b").click(function() {//点击人群密度
        $(".list-b .title-box .t-a").removeClass('active');
        $(this).addClass('active');
        resizeLineA(1);
    })
更换装图表的盒子(div)和线性图表信息:
    function resizeLineA(n) {
        $(".line-cen").remove();//先移除原有的盒子
        var aa = document.createElement('div');//在创建一个新盒子装图表
        aa.id = 'ec3'
        aa.className = 'line-cen'
        $(".line-box").append(aa)
        if (n == 1) {
            lineSetA();//显示人群密度图表
        } else {
            lineSetB();//显示流量趋势图表
        }
    }
效果如下图:
除此之外,还可以根据实际情况再添加相应的图表。
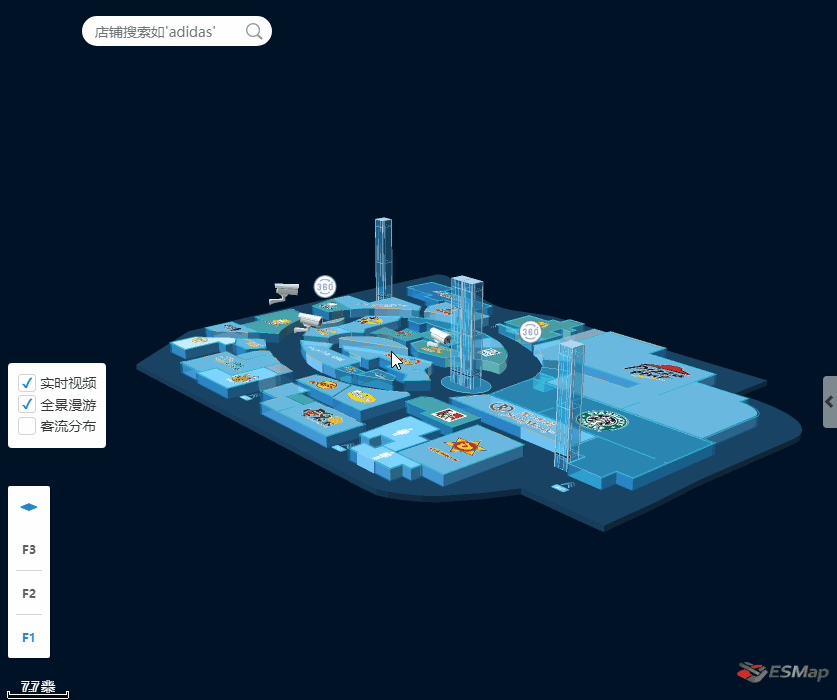
2.check控制面板
开发一个控制面板,对管理者来说可以更好的全局掌握控制商场情况我在控制面板上加了实时视频,全景漫游和客流分布,下面就这三个功能的实现过程做下介绍。
(1)客流分布热力图功能,以下载入的是模拟数据,投入使用后可直接载入实际数据,根据数据体现热力图的情况。
//添加热力图,根据json文件
function addHeatMap() {
    // 创建热力图对象
    if (!heatmapInstance)
        heatmapInstance = esmap.ESHeatMap.create(map, {
            radius: 24, //热点半径
            opacity: .5, //热力图透明度
            max: 35, //热力点value的最大值
            maxSize: 2048,
            gradient: {//渐变色值,可配
                0.35: "green",
                0.5: "yellow",
                0.7: "orange",
                0.85: "red"
            }
    $.getJSON("data/003.json", function(data) { //数据载入
        var datas = data.datas;
        var len = datas.length;
        exec(datas[0]["data"][0]["fnum"], datas[0]["data"][0]["points"]);//绘制热力图
        var index = 1;
        timer1 = setInterval(function () {
            if (index > 1) index = 0;
            for (var el of datas[0]["data"][0]["points"]) {
                switch (index) {
                    case 0: el.value = el.value - 1;
                    break;
                    case 1: el.value = el.value + 1;
                    break;
                }
            }
            exec(datas[0]["data"][0]["fnum"], datas[0]["data"][0]["points"]);
            index++;
        }, 2000)
        return;
    });
    function exec(fnum, points) {//绘制热力图函数
        var floorLayer = map.getFloor(fnum);//获取应用楼层
        heatmapInstance.clearPoints();//清除热力点
        heatmapInstance.addPoints(points);//热力点添加到热力图
        //热力图应用到哪一楼层
        floorLayer.applyHeatMap(heatmapInstance);
    }
}
热力图如下:
(2)实时视频及全景漫游的实现:
首先创建实时视频的摄像头图片标注和全景漫游的360°图片标注,标注实现后可在地图上点击相应的图片标注从而显示实时视频画面或360°全景画面,画面可拖拽可放大缩小。
各楼层实时视频的摄像头图片标注:
//创建各楼层摄像头标注
function showCameras() {
    var url = 'data/test666/model/camera1.js';
    //json数据,定义摄像头所在楼层和位置
    var infos = [{
        fnum: 1,
        cameras: [{
                x: 12683472.409512023,
                y: 2557870.1781415385,
            },
            {
                x: 12683450.258123305,
                y: 2557858.104209115
            },
            {
                x: 12683430.863774385,
                y: 2557865.8999765064
            }
        ]
    }, {
        fnum: 2,
        cameras: [{
                x: 12683472.409512023,
                y: 2557870.1781415385,
            },
            {
                x: 12683450.258123305,
                y: 2557858.104209115
            },
            {
                x: 12683430.863774385,
                y: 2557865.8999765064
            }
        ]
    }, {
        fnum: 3,
        cameras: [{
                x: 12683472.409512023,
                y: 2557870.1781415385,
            },
            {
                x: 12683450.258123305,
                y: 2557858.104209115
            },
            {
                x: 12683430.863774385,
                y: 2557865.8999765064
            }
        ]
    }];
    //创建三维模型标注  实时视频摄像头
    var ang = 0;
    infos.forEach(function (info) {
        var floorLayer = map.getFloor(info.fnum);
        var layer = floorLayer.getOrCreateLayerByName("cameras", esmap.ESLayerType.MODEL3D);
        var _id = 1;
        info.cameras.forEach(function (camera) {
            var im = new esmap.ES3DMarker({
                x: camera.x,
                y: camera.y,
                id: _id++,
                name: "camera",
                url: url,
                size: 44,
                angle: ang,
                height: 3,
                showLevel: 16,
                spritify: true
            });
            ang += 30;
            layer.addMarker(im);//一个楼层共用一个图层
        });
        layer && layer.show3D();
    });
}
点击地图展示实时视频或全景漫游弹框(div)函数active():
//地图点击标注后  临时创建div盒子  放全景图或实时视频
function active(e, type) { // type: 1.pano; 0.video
var cc = $($(".drag")[0]).clone();
    var wid = $(".drag").width();

    $("body").append(cc);
    cc[0].style.display = "block";
    if (__xx < wid) {
        __xx = wid;
    }
    cc[0].style.left = (__xx - wid - 20).toString() + "px";
    cc[0].style.top = (__yy - 25 / 2).toString() + "px";

    if (!type) {
        cc.find('.content')[0].innerHTML = '<video class="video_" src="videos/' + e.id_ + '.mp4" autoplay loop></video>';
        cc.find('.title h2')[0].innerHTML = '实时视频';
        createPopBox();
    } else {
        cc.find('.title h2')[0].innerHTML = '全景展示';

        var box = document.createElement('div');

        cc.find('.content').append(box);
        box.className = 'psv-box';

        oPano = new CreatePanorama({
            container: box,
            panorama: 'image/pano/' + e.id + '/',
            six: 1
        })
        createPopBox(oPano);
    }
}
展示的弹框可拖拽、大小可调整,功能实现如下函数:
/*可拖拽可放大缩小弹框*/
function createPopBox(pano) { // pano: 0.视频,1.全景
    /*-------------------------- +
    获取id, class, tagName 函数
    +-------------------------- */
    var get = {
        byId: function (id) {
            return typeof id === "string" ? document.getElementById(id) : id;
        },
        byClass: function (sClass, oParent) {
            var aClass = [];
            var reClass = new RegExp("(^| )" + sClass + "( |$)");
            var aElem = this.byTagName("*", oParent);
            for (var i = 0; i < aElem.length; i++) reClass.test(aElem[i].className) && aClass.push(aElem[i]);
            return aClass
        },
        byTagName: function (elem, obj) {
            return (obj || document).getElementsByTagName(elem);
        }
    };
    var dragMinWidth = 250;
    var dragMinHeight = 173;
    /*-------------------------- +
    拖拽函数
    +-------------------------- */
    function drag(oDrag, handle) {
        var disX = dixY = 0;
        var oMax = get.byClass("max", oDrag)[0];//获取最大化div的 class
        var oRevert = get.byClass("revert", oDrag)[0];//获取恢复div的 class
        var oClose = get.byClass("close", oDrag)[0];//获取关闭div的  class
        handle = handle || oDrag;
        handle.style.cursor = "move";
        handle.onmousedown = function (event) {
            var event = event || window.event;
            disX = event.clientX - oDrag.offsetLeft;
            disY = event.clientY - oDrag.offsetTop;

            document.onmousemove = function (event) {
                var event = event || window.event;
                var iL = event.clientX - disX;
                var iT = event.clientY - disY;
                var maxL = document.documentElement.clientWidth - oDrag.offsetWidth;
                var maxT = document.documentElement.clientHeight - oDrag.offsetHeight;

                iL <= 0 && (iL = 0);
                iT <= 0 && (iT = 0);
                iL >= maxL && (iL = maxL);
                iT >= maxT && (iT = maxT);

                oDrag.style.left = iL + "px";
                oDrag.style.top = iT + "px";

                return false
            };
            document.onmouseup = function () {
                document.onmousemove = null;
                document.onmouseup = null;
                this.releaseCapture && this.releaseCapture()
            };
            this.setCapture && this.setCapture();
            return false
        };
        //最大化按钮
        oMax.onclick = function () {
            if (!pano) {
                $(this).parents('.drag').find('.video_')[0].webkitEnterFullscreen(true);
            } else {
                fullPano = 1;
                oDrag.classList.add('over-auto');
                var _box = $(oDrag).find('.psv-box')[0];

                _box.classList.add('psv-full', 'over-auto');

                var _div = document.createElement('div');
                document.body.append(_div);
                _div.className = 'psv-full-btns';
                _div.innerHTML = '<a class="full-revert" href="javascript:;" title="还原"></a>'

                document.onkeydown = function (e) {
                    if (e.keyCode == 27 && fullPano == 1) {
                        fullPano = 0;
                        oDrag.classList.remove('over-auto');
                        _box.classList.remove('psv-full', 'over-auto');
                        _div.remove();
                        pano.onWindowResize();
                    }
                }

                $(_div).find('.full-revert').click(function () {
                    fullPano = 0;
                    oDrag.classList.remove('over-auto');
                    _box.classList.remove('psv-full', 'over-auto');
                    _div.remove();
                    pano.onWindowResize();
                })

                pano.onWindowResize();
            }
        };
        //还原按钮
        oRevert.onclick = function () {
            oDrag.style.width = dragMinWidth + "px";
            oDrag.style.height = dragMinHeight + "px";
            oDrag.style.left = (document.documentElement.clientWidth - oDrag.offsetWidth) / 2 + "px";
            oDrag.style.top = (document.documentElement.clientHeight - oDrag.offsetHeight) / 2 + "px";
            this.style.display = "none";
            oMax.style.display = "block";
            pano && pano.onWindowResize();
        };
        //关闭按钮
        oClose.onclick = function () {
            if (!pano) {
                $(this).parents('.drag').remove();
            } else {
                oPano = null;
                $(this).parents('.drag').remove();
            }
        };
        //阻止冒泡
        oMax.onmousedown = oClose.onmousedown = function (event) {
            this.onfocus = function () {
                this.blur();
            };
            (event || window.event).cancelBubble = true
        };
    }
    /*-------------------------- +
    改变大小函数
    +-------------------------- */
    function resize(oParent, handle, isLeft, isTop, lockX, lockY) {
        handle.onmousedown = function (event) {
            var event = event || window.event;
            var disX = event.clientX - handle.offsetLeft;
            var disY = event.clientY - handle.offsetTop;
            var iParentTop = oParent.offsetTop;
            var iParentLeft = oParent.offsetLeft;
            var iParentWidth = oParent.offsetWidth;
            var iParentHeight = oParent.offsetHeight;

            document.onmousemove = function (event) {
                var event = event || window.event;

                var iL = event.clientX - disX;
                var iT = event.clientY - disY;
                var maxW = document.documentElement.clientWidth - oParent.offsetLeft - 2;
                var maxH = document.documentElement.clientHeight - oParent.offsetTop - 2;
                var iW = isLeft ? iParentWidth - iL : handle.offsetWidth + iL;
                var iH = isTop ? iParentHeight - iT : handle.offsetHeight + iT;

                isLeft && (oParent.style.left = iParentLeft + iL + "px");
                isTop && (oParent.style.top = iParentTop + iT + "px");

                iW < dragMinWidth && (iW = dragMinWidth);
                iW > maxW && (iW = maxW);
                lockX || (oParent.style.width = iW + "px");

                iH < dragMinHeight && (iH = dragMinHeight);
                iH > maxH && (iH = maxH);
                lockY || (oParent.style.height = iH + "px");

                if ((isLeft && iW == dragMinWidth) || (isTop && iH == dragMinHeight)) document.onmousemove = null;

                pano && pano.onWindowResize();

                return false;
            };
            document.onmouseup = function () {
                document.onmousemove = null;
                document.onmouseup = null;
            };
            return false;
        }
    };
    function aaa() {
        var dom = document.getElementsByClassName("drag");
        var oDrag = dom[dom.length - 1];

        var oTitle = get.byClass("title", oDrag)[0];
        var oL = get.byClass("resizeL", oDrag)[0];
        var oT = get.byClass("resizeT", oDrag)[0];
        var oR = get.byClass("resizeR", oDrag)[0];
        var oB = get.byClass("resizeB", oDrag)[0];

        var oLT = get.byClass("resizeLT", oDrag)[0];
        var oTR = get.byClass("resizeTR", oDrag)[0];
        var oBR = get.byClass("resizeBR", oDrag)[0];
        var oLB = get.byClass("resizeLB", oDrag)[0];

        drag(oDrag, oTitle);
        //拉四角
        resize(oDrag, oLT, true, true, false, false);
        resize(oDrag, oTR, false, true, false, false);
        resize(oDrag, oBR, false, false, false, false);
        resize(oDrag, oLB, true, false, false, false);
        //拉四边
        resize(oDrag, oL, true, false, false, true);
        resize(oDrag, oT, false, true, true, false);
        resize(oDrag, oR, false, false, false, true);
        resize(oDrag, oB, false, false, true, false);

        oDrag.style.left = (document.documentElement.clientWidth - oDrag.offsetWidth) / 2 + "px";
        oDrag.style.top = (document.documentElement.clientHeight - oDrag.offsetHeight) / 2 + "px";
    }
    aaa();
}
功能都实现后投入使用,点击地图上的标注显示相应的实时视频,这里我使用了ESMap的地图点击事件map.on(“mapClickNode”,function(){});
 map.on("mapClickNode", function (e) {
        removeAll();
        if (e.nodeType && e.nodeType == 31 && e.name && e.name == 'myMarker') {//全景
            active(e, 1);
        }
        if (e.nodeType && e.nodeType == 6 && e.name && e.name == 'camera') {//视频
            active(e)
        }
        if (e.nodeType && e.nodeType == 5) {//点击地图商铺显示相应运营情况
            if (e.name) {
                var obj = {
                    id: e.ID,
                    fnum: e.FloorNum,
                    x: e.x,
                    y: e.y,
                    name: e.name
                }
                searchClick(obj);// 函数如下
} } })
封装气泡标注函数searchClick(),显示商铺信息:
function searchClick(data, isAddImageMarker) {
    if (!data.name) return;
    // 添加pop
    removeAll();
    var floorLayer = map.getFloor(data.fnum);

    if (isAddImageMarker) {
        floorControl.changeFocusFloor(data.fnum);
    }
    if (data.name == '房间') {
        var dom = '<div class="pop-content"><strong>房间 ' + data.id + '</strong><p>经度:' + data.x.toFixed(3) + '</p><p>纬度:' + data.y.toFixed(3) + '</p></div>';
    } else {
        var shopDatas = getShopMsg(data.id);//数字number
        var dom = '<div class="pop-content"><strong>' + data.name + '</strong><p>人流量:' + shopDatas.msgA + '</p><p>营业额:' + shopDatas.msgB + '</p></div>'
    }
    //添加信息窗
    popMarker = new esmap.ESPopMarker({
        mapCoord: {
            //设置弹框的x轴
            x: data.x,
            //设置弹框的y轴
            y: data.y,
            height: 1, //控制信息窗的高度
            //设置弹框位于的楼层
            fnum: data.fnum
        },
        //设置弹框的宽度
         200,
        //设置弹框的高度
        height: 120,
        marginTop: 10,
        //设置弹框的内容
        content: dom,
        // content: '<input id="pop-input" type="text"/>',
        closeCallBack: function () {
            //信息窗点击关闭操作
            // alert('信息窗关闭了!');
        },
    });
    $(".es-control-popmarker input").val('✖'); // 手动添加close按钮value
}
效果图如下:

各楼层全景漫游的360°图片标注:
//创建360°图片标注到各层
function showImageMarker() {
    var _arr = [{
        fnum: 1,
        node: [{
                x: 12683473.823037906,
                y: 2557891.805802924,
            },
            {
                x: 12683424.1333389,
                y: 2557880.7494297,
            }
        ]
    }, {
        fnum: 2,
        node: [{
                x: 12683473.823037906,
                y: 2557891.805802924,
            },
            {
                x: 12683424.1333389,
                y: 2557880.7494297,
            }
        ]
    }, {
        fnum: 3,
        node: [{
                x: 12683473.823037906,
                y: 2557891.805802924,
            },
            {
                x: 12683424.1333389,
                y: 2557880.7494297,
            }
        ]
    }]
    for (var el of _arr) {
        var floorLayer = map.getFloor(el.fnum);
        var im_layer = new esmap.ESLayer('imageMarker');//创建图层
        im_layer.name = 'mylayer';//给图层命名
        var index = 1;
        for (var el2 of el.node) {
            var im = new esmap.ESImageMarker({
                x: el2.x,
                y: el2.y,
                url: 'image/360.png',
                id: index++,
                size: 50,
                name: 'myMarker',
                zoom: 2,
            })
            im_layer.addMarker(im);
            floorLayer.addLayer(im_layer);
        }
    }
}
图片标注创建后,使用three.JS创建全景图,然后绑定鼠标事件
function CreatePanorama(prop) {
    var camera, scene, renderer, container, mesh;
    var texture_placeholder,
        target = new THREE.Vector3();//创建3维向量

    this.container = container;
    this.panorama = prop.panorama;
    this.camera = camera;
    this.scene = scene;
    this.renderer = renderer;
    this.mesh = mesh;

    function init() {
        container = prop.container;
        camera = new THREE.PerspectiveCamera(75, container.clientWidth / container.clientHeight, 1, 1100);
        scene = new THREE.Scene();
        texture_placeholder = document.createElement('canvas');
        texture_placeholder.width = 128;
        texture_placeholder.height = 128;

        var context = texture_placeholder.getContext('2d');
        context.fillStyle = 'rgb( 200, 200, 200 )';
        context.fillRect(0, 0, texture_placeholder.width, texture_placeholder.height);

        if (prop.six) {
            var materials = [
       loadTexture(prop.panorama + 'r.jpg'), // right
                loadTexture(prop.panorama + 'l.jpg'), // left
                loadTexture(prop.panorama + 'u.jpg'), // top
                loadTexture(prop.panorama + 'd.jpg'), // bottom
                loadTexture(prop.panorama + 'b.jpg'), // back
                loadTexture(prop.panorama + 'f.jpg') // front
            ];
            var matss = new THREE.MultiMaterial(materials)
            mesh = new THREE.Mesh(new THREE.BoxGeometry(300, 300, 300, 7, 7, 7), matss);
        } else {
            var geometry = new THREE.SphereGeometry(100, 64, 64, -1.5707963267948966);
            var material = new THREE.MeshBasicMaterial({
                map: new THREE.TextureLoader().load(prop.panorama),
            })
            mesh = new THREE.Mesh(geometry, material);
        }
        mesh.scale.x = -1;
        scene.add(mesh);

        renderer = new THREE.WebGLRenderer({//创建一个webGL渲染器,renderer
            antialias: true
        })
        renderer.setPixelRatio(window.devicePixelRatio);//设备设置像素比
        renderer.setSize(container.clientWidth, container.clientHeight);//调整输出canvas尺寸

        container.appendChild(renderer.domElement);
        //监听鼠标各种事件
           container.addEventListener('mousedown', onDocumentMouseDown, false);
        container.addEventListener('mousemove', onDocumentMouseMove, false);
        container.addEventListener('mouseup', onDocumentMouseUp, false);
        container.addEventListener('wheel', onDocumentMouseWheel, false);

        container.addEventListener('touchstart', onDocumentTouchStart, false);
        container.addEventListener('touchmove', onDocumentTouchMove, false);

        window.addEventListener('resize', onWindowResize, false);
    }
}
全景漫游完成,在地图上点击、拖拽、缩放功能如实时视频一样,效果如下图:
3.创建一个搜索框,可以直接锁定目标,查看店铺运营情况
// 通过店名搜索地图中店铺  搜索框函数
function searchByName(name) {
    Listmodel.item = [];
    if (!name) return;
    var data = map.mapService.sourceData.floors;//获取地图信息
    for (var ele of data) {//遍历获取到的信息
        for (var i in ele.Rooms) { //遍历获取到数组里的Rooms
            var el = ele.Rooms[i];
            if (el.name) {
                var a = el.name.indexOf(name);//查找输入的店名是否在地图内存在
                if (a != -1) {//如果存在
                    var obj = {
                        x: el.CenX,
                        y: el.CenY,
                        id: el._id,
                        fnum: ele.floornum,
                        name: el.name
                    }
                    Listmodel.item.push(obj);//把输入的店名信息存入数组
                }
            }
        }
    }
}
效果如下图:
以上就是我就商场管理者在管理过程中所面临的一些问题,开发的商场管理系统的一个界面,当然我只是简单实现了一些功能,在实际开发过程可根据实际情况定制一些功能方案,从而达到管理者高效管理的目的。ESMap-SDK提供的免费地图开发和热力图、图片标注等功能实现的支持。
Thank you for reading!