初学者,练习以下片段:
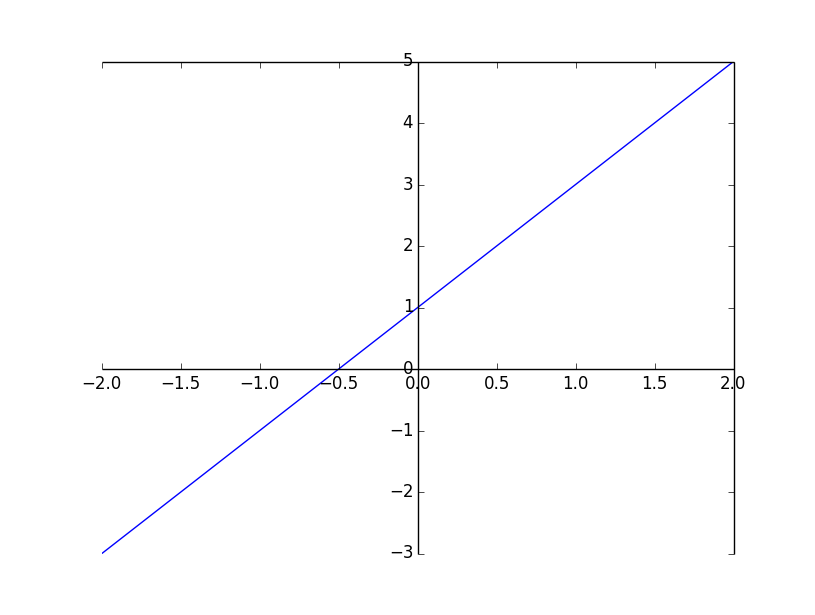
代码1:用 一元一次函数 画直线
import matplotlib.pyplot as plt
import numpy as np

x = np.linspace(-2, 2, 50)
print(x)
y = 2*x + 1
plt.plot(x, y)
ax = plt.gca()
ax.spines['bottom'].set_position(('data',0))
ax.spines['left'].set_position(('data',0))
plt.show()
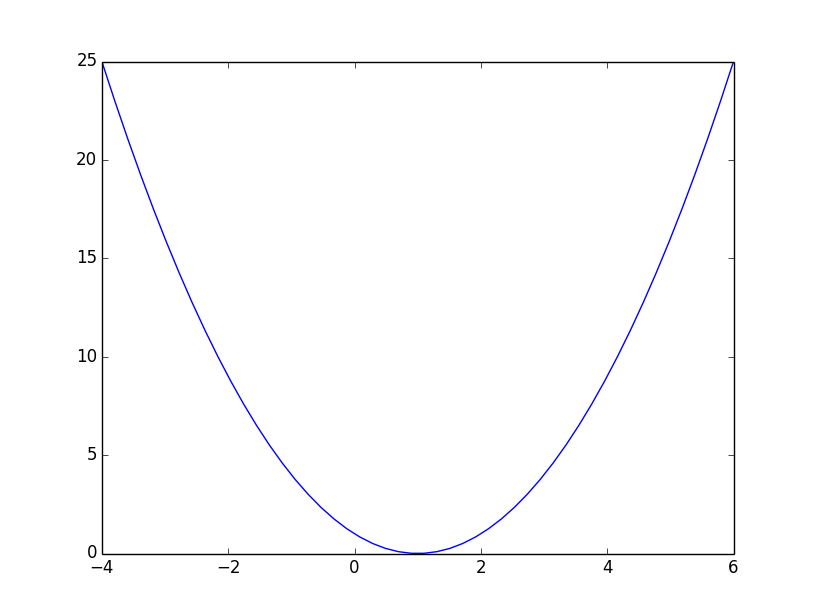
代码2:用 一元二次函数 画抛物线
import matplotlib.pyplot as plt
import numpy as np

x = np.linspace(-4, 6, 50)
print(type(x))
print(x)
y = x**2 - x*2+1
plt.plot(x, y)
plt.show()
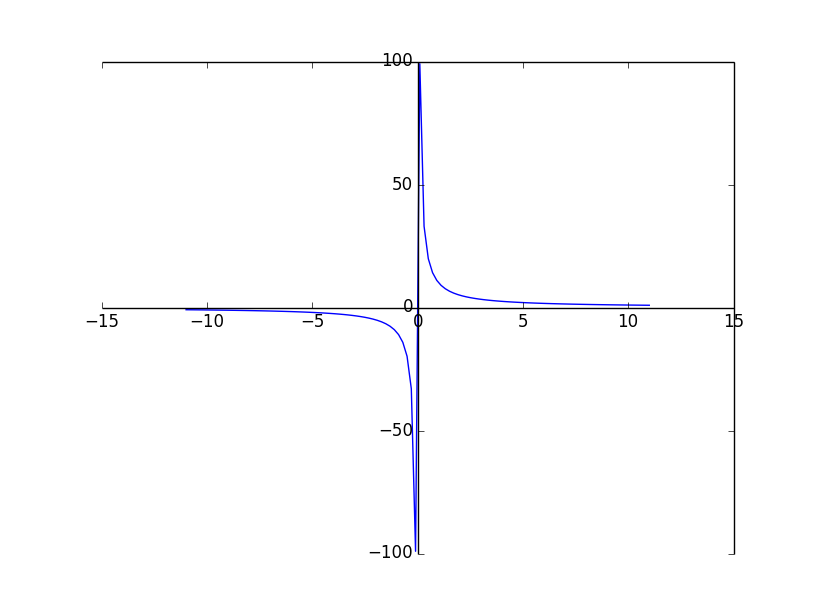
代码3:用反比例函数 画曲线
import matplotlib.pyplot as plt
import numpy as np

x = np.linspace(-11, 11, 110)
print(x)
y =10/x
plt.plot(x, y)
ax = plt.gca()
ax.spines['bottom'].set_position(('data',0))
ax.spines['left'].set_position(('data',0))
plt.show()
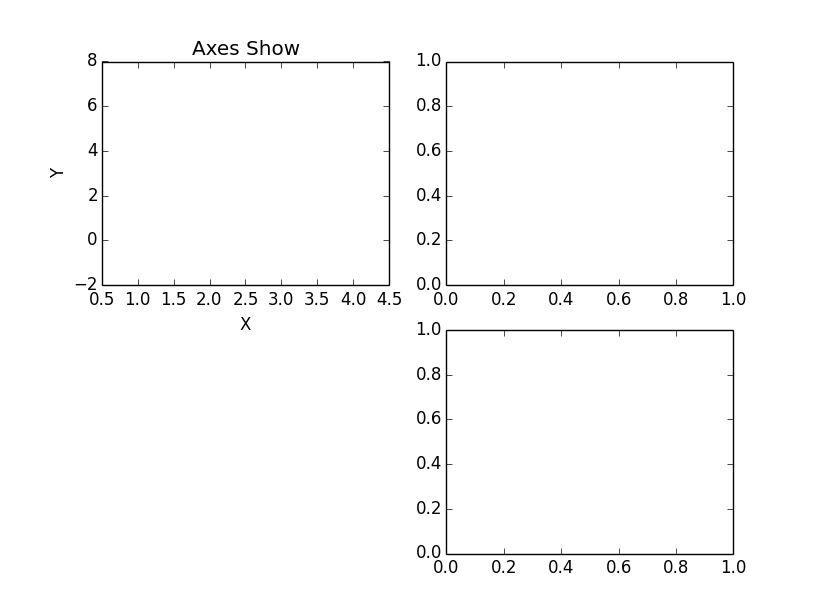
代码4:子坐标系的应用
import matplotlib.pyplot as plt
fig = plt.figure()
ax1 = fig.add_subplot(221)
ax2 = fig.add_subplot(222)
ax3 = fig.add_subplot(224)
ax1.set(xlim=[0.5, 4.5], ylim=[-2, 8], title='Axes Show',
       ylabel='Y', xlabel='X')
plt.show()
代码5:子坐标系的应用
import matplotlib.pyplot as plt
fig = plt.figure()
fig,axes=plt.subplots(nrows=2, ncols=2)
axes[0,0].set(xlim=[0.5, 4.5], ylim=[-2, 8], title='Axes Show',
       ylabel='Y', xlabel='X')
axes[0,1].set(title='Upper Right')
axes[1,0].set(title='Lower Left')
axes[1,1].set(title='Lower Right')
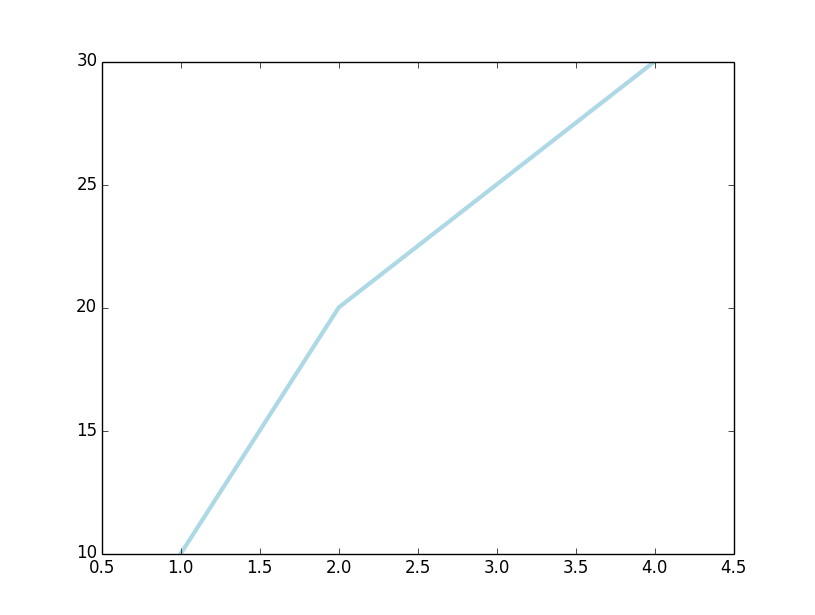
代码6:用已知少量坐标值画曲线
import matplotlib.pyplot as plt
plt.plot([1, 2, 3, 4], [10, 20, 25, 30], color='lightblue', linewidth=3)
plt.xlim(0.5, 4.5)
plt.show()
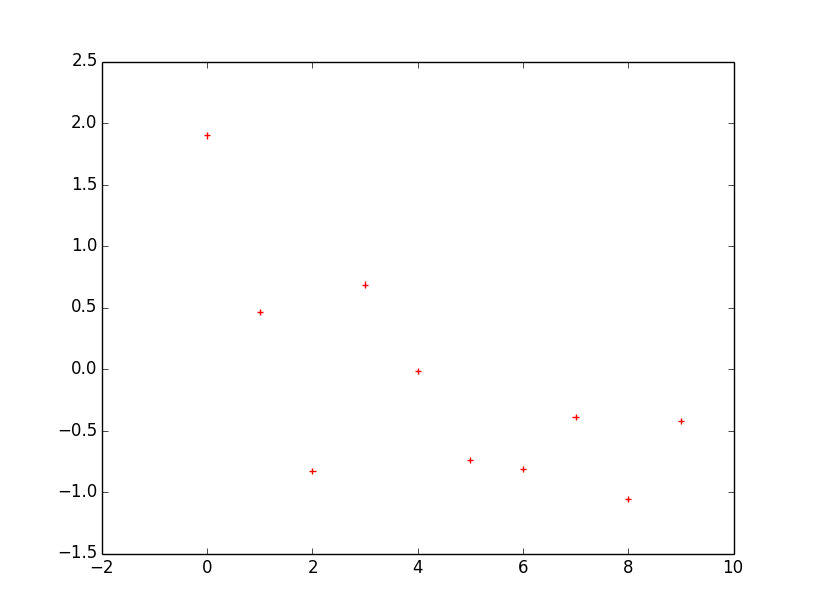
代码7:画离散点
mport matplotlib.pyplot as plt
import numpy as np
x = np.arange(10)
y = np.random.randn(10)
print(y)
plt.scatter(x, y, color='red', marker='+')
plt.show()
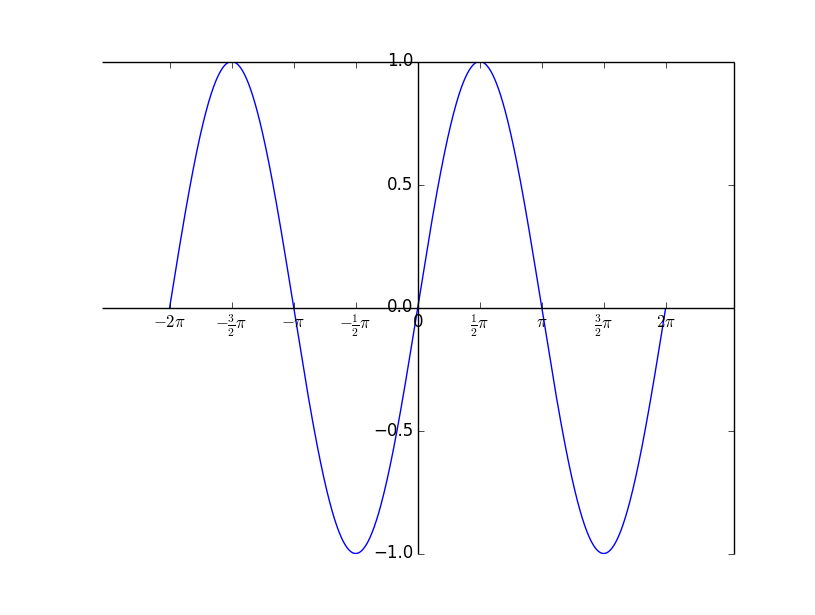
代码8:画出正弦曲线
import numpy as np
import matplotlib.pyplot as plt
x=np.arange(-2*np.pi,2*np.pi,0.01)
y=np.sin(x)
plt.plot(x,y)
ax = plt.gca()
ax.spines['bottom'].set_position(('data',0))
ax.spines['left'].set_position(('data',0))
plt.xticks([-np.pi*2,-np.pi*3/2,-np.pi, -np.pi/2, 0, np.pi/2, np.pi,np.pi*3/2,np.pi*2],[r'$-2pi$',r'$-frac{3}{2} pi$',r'$-pi$',r'$-frac{1}{2}pi$', r'0', r'$frac{1}{2}pi$','$pi$',r'$frac{3}{2}pi$',r'$2 pi$'])
plt.show()