
何时用SVG何时用canvas
SVG
矢量图,视觉清晰,文件小
<svg viewBox="0 0 100 100">

  <circle cx="50" cy="50" r="50" />

  <style>
    circle { fill: blue; animation: pulse 2s alternate infinite; }
    @keyframes pulse {
      100% {
        r: 30;
      }
    }
  </style>

  <script>
    document.querySelector('circle').addEventListener('click', e => {
      e.target.style.fill = "red";
    });
  </script>

</svg>
关键可以放在一起玩
Canvas
是javascript绘图API
大佬提出来的想法是:
SVG是默认选择,画布是备份,简单的说当你不能使用SVG时候才使用canvas
canvas 元素
<canvas id="tutorial" width="150" height="150"></canvas>
渲染上下文
var canvas = document.getElementById('tutorial');
var ctx = canvas.getContext('2d');
编写一个基本骨架
 <style>
    #canvas{
      border:1px solid #ccc;
    }
  </style>
  <canvas id="canvas" width="150" height="150"></canvas>
绘制矩形
fillRect(x, y, width, height)
绘制一个填充的矩形
strokeRect(x, y, width, height)
绘制一个矩形的边框
clearRect(x, y, width, height)
清除指定矩形区域,让清除部分完全透明。
案例
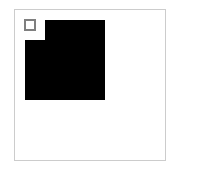
  let canvas = document.querySelector('#canvas')
  let ctx = canvas.getContext('2d')
  // 填充
  ctx.fillRect(10,10,80,80)
  // 删除部分
  ctx.clearRect(10,10,20,20)
  // 填充边框的矩形
  ctx.strokeRect(10,10,10,10)
绘制路径
- 创建路径起始点
- 画图命令绘制路径
- 路径闭合
- 路径生成后,通过描边或填充路径来渲染图形
deginpath()
新建一条路径
closePath()
闭合路径
stroke()
通过线条绘制图形轮廓
fill()
通过填充路径绘制成实心的图形
案例
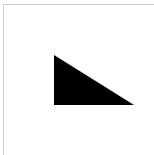
绘制一个三角形
let ctx = canvas.getContext('2d')
  ctx.beginPath()
  ctx.moveTo(50, 50)// 点
  ctx.lineTo(50, 100)// 直线
  ctx.lineTo(130, 100)//
  ctx.fill()
MoveTo(x,y)
将笔触移动到指定的坐标x以及y上
lineTo(x, y)
绘制一条从当前位置到指定x以及y位置的直线。
 // 描边三角形
  ctx.beginPath()
  ctx.moveTo(50, 50)// 点
  ctx.lineTo(50, 100)// 直线
  ctx.lineTo(130, 100)//
  ctx.closePath()
  ctx.stroke()

lineWidth 行宽
strokeStyle 边框的颜色
ctx.lineWidth=5
ctx.strokeStyle='red'
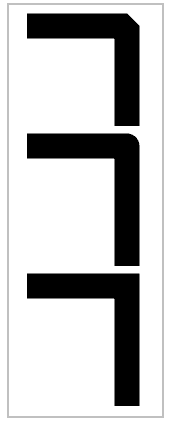
lineCap 线头
- butt 默认
- round 半圆形
- square 移动到末端

      context.lineCap = 'butt';
	 context.lineCap = 'round';
	 context.lineCap = 'square';
lineJoin 线连接
- bevel 斜角
- round 圆角
- square 默认
ctx.lineJoin = "bevel";
ctx.lineJoin = "round";
默认  "square"
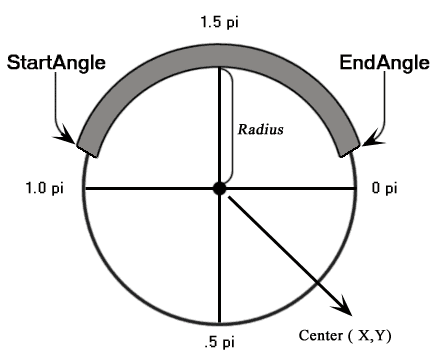
圆弧
arc()
度数转为弧度公式
度数*Math.PI/180
方法
arc(x,y,radius,startAngle,endAngle,direction)
画一个以(x,y)为圆心的以radius为半径的圆弧(圆),从startAngle开始到endAngle结束,direction方向true顺时针,false逆时针,默认顺时针true
用弧度画一个圆
 let ctx = canvas.getContext('2d')
  ctx.beginPath()
  ctx.moveTo(250, 250)// 点
  ctx.arc(250,250,100,0,2 * Math.PI,)
  ctx.closePath()
  ctx.stroke()
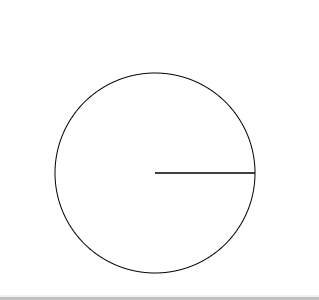
我们要记住开始的弧度和结束的弧度记住上面的公式,一个圆是2*Math.PI
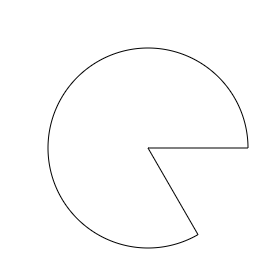
所以半圆是Math.PI
ctx.arc(250,250,100,1/3*Math.PI,2 * Math.PI,)
开始位置是1/3,结束位置是终点位置
arcTo
arcTo(x1,y1,x2,y2,radius)
画曲线,要想明白它们之间的关系需要画辅助线
 let x0 = 100,
    y0 = 100,
    x1 = 400,
    y1 = 100,
    x2 = 350,
    y2 = 150;

  ctx.beginPath();
  ctx.moveTo(x0, y0);
  ctx.strokeStyle = "#f00";
  ctx.lineWidth = 2;
  ctx.arcTo(x1, y1, x2, y2, 20);
  ctx.stroke();

  ctx.beginPath();
  ctx.strokeStyle = "rgba(0,0,0,0.5)";
  ctx.lineWidth = 1;
  ctx.moveTo(x0, y0);
  ctx.lineTo(x1, y1);
  ctx.fillText('x1,y1', x1 + 10, y1 + 10)
  ctx.lineTo(x2, y2);
  ctx.fillText('x2,y2', x2 + 10, y2)
  ctx.stroke();
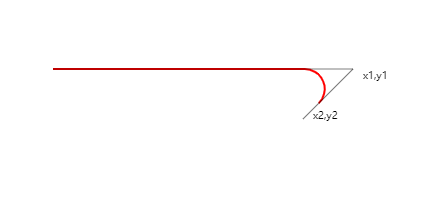
说明一下,x0,y0 起点坐标,x1,y1 第一个点坐标,x2,y2 第二个坐标
arcTo的规律: 他其实是通过起点,第1点,第2点的两条直线,组成了一个夹角,而这两条线,也是参数圆的切线。其中圆的半径决定了圆会在什么位置与线条发生切边。
让我们把球球变大吧!
ctx.arcTo(x1,y1,x2,y2,50); //半径改成50

我们发现他们还是相切的,因为切线可以无限延长
为了方便计算,我先把两条线的夹角改成90度。
var x0=100,
y0=400,
x1 = 500,
y1 = 400,
x2 = 500,
y2 = 450;
更改后就是90度张开了哟!我们保持球的半径不变。刷新后:

我们把y2变大,也就是延长了一条切线,把他变成550,刷新后:

切线是延长了,但arcTo画出的红线没有任何变化。
写一个可行的案例吧
-
绘制一个背景网格
// 绘制网格 grid for (let x = 0.5; x < 500; x += 10) { ctx.moveTo(x, 0); ctx.lineTo(x, 500) } for (let y = 0; y < 500; y += 10) { ctx.moveTo(0, y) ctx.lineTo(500, y) } ctx.strokeStyle = '#eee'; ctx.stroke(); -
画两条直线相交
// lines ctx.strokeStyle = 'gray'; ctx.lineWidth = 1; ctx.beginPath() ctx.moveTo(51, 24) ctx.lineTo(314, 540) ctx.moveTo(477, 34) ctx.lineTo(86, 484) ctx.stroke(); -
绘制两条线上的点
问题来了两点确定一条直线怎么知道线上的点的位置关系
两点式公式
(y-y2)/(y1-y2) = (x-x2)/(x1-x2)
-
求两条直线上面的交点
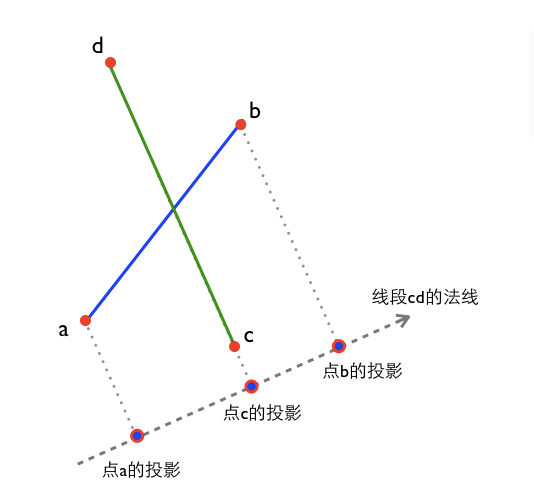
function segmentsIntr(a, b, c, d){

  //线段ab的法线N1
  let nx1 = (b.y - a.y), ny1 = (a.x - b.x);

  //线段cd的法线N2
  let nx2 = (d.y - c.y), ny2 = (c.x - d.x);

  //两条法线做叉乘, 如果结果为0, 说明线段ab和线段cd平行或共线,不相交
  let denominator = nx1*ny2 - ny1*nx2;
  if (denominator==0) {
    return false;
  }

  //在法线N2上的投影
  let distC_N2=nx2 * c.x + ny2 * c.y;
  let distA_N2=nx2 * a.x + ny2 * a.y-distC_N2;
  let distB_N2=nx2 * b.x + ny2 * b.y-distC_N2;

  // 点a投影和点b投影在点c投影同侧 (对点在线段上的情况,本例当作不相交处理);
  if ( distA_N2*distB_N2>=0  ) {
    return false;
  }

  //
  //判断点c点d 和线段ab的关系, 原理同上
  //
  //在法线N1上的投影
  let distA_N1=nx1 * a.x + ny1 * a.y;
  let distC_N1=nx1 * c.x + ny1 * c.y-distA_N1;
  let distD_N1=nx1 * d.x + ny1 * d.y-distA_N1;
  if ( distC_N1*distD_N1>=0  ) {
    return false;
  }

  //计算交点坐标
  let fraction= distA_N2 / denominator;
  let dx= fraction * ny1,
    dy= -fraction * nx1;
  return { x: a.x + dx , y: a.y + dy };
}

console.log(segmentsIntr({x: 51, y: 24}, {x: 314, y: 540}, {x: 477, y: 34}, {x: 86, y: 484}));
上demo代码
  // 两点式公式
  // (y-y2)/(y1-y2) = (x-x2)/(x1-x2)。
  // 我们设y=200,可以求出x=140.7
  ctx.beginPath()
  ctx.moveTo(140.7,200)
  ctx.arc(140.7,200,5,0,2*Math.PI)
  // 设x=350,求右边直线的y点 180.16
  ctx.moveTo(350,180.16)
  ctx.arc(350,180.16,5,0,2*Math.PI)
  // 求原点坐标
  ctx.moveTo(211.713,339.3166)
  ctx.arc(211.713,339.3166,5,0,2*Math.PI)
  ctx.fillStyle = 'red';
  ctx.fill();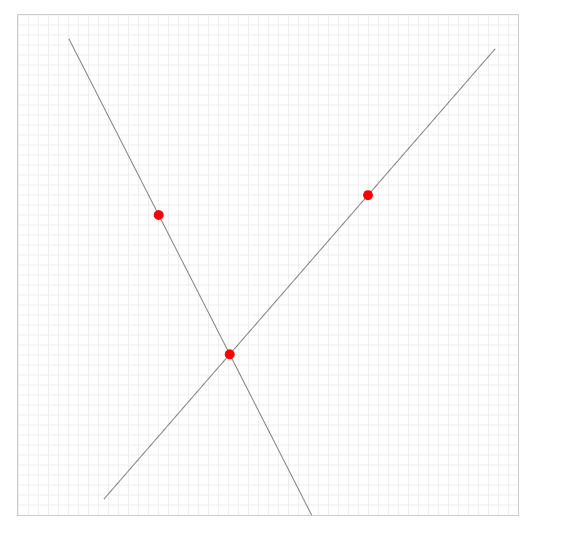
-
标记点的位置
ctx.font='14px Arial' ctx.beginPath() ctx.fillText("(x0,y0)",140.7+5,200+5) ctx.fillText("(x1,y1)",350+5,180.16+5) ctx.fillText("(x2,y2)",211.713+5,339.3166+5) -
画
arcTo曲线// 编写arcTo ctx.beginPath() ctx.lineWidth=3; ctx.moveTo(140.7,200) ctx.arcTo(211.713,339.3166,350,180.16,100) ctx.stroke()
-
问题又来了,我该怎么求这个切点的坐标呢
唉,我这种菜鸡都忘记啦...
我想出来的方法手动移动,我就不写了,都忘光了
全部代码集合
let canvas = document.querySelector('#canvas') let ctx = canvas.getContext('2d'); // 绘制网格 grid for (let x = 0.5; x < 500; x += 10) { ctx.moveTo(x, 0); ctx.lineTo(x, 500) } for (let y = 0; y < 500; y += 10) { ctx.moveTo(0, y) ctx.lineTo(500, y) } ctx.strokeStyle = '#eee'; ctx.stroke(); // lines ctx.strokeStyle = 'gray'; ctx.lineWidth = 1; ctx.beginPath() ctx.moveTo(51, 24) ctx.lineTo(314, 540) // k=(y2-y1)/(x2-x1) ctx.moveTo(477, 34) ctx.lineTo(86, 484) ctx.stroke(); // 原点 // 问题来了两点确定一条直线怎么知道线上的点的位置关系 // 两点式公式 // (y-y2)/(y1-y2) = (x-x2)/(x1-x2)。 // 我们设y=200,可以求出x=140.7 ctx.beginPath() ctx.moveTo(140.7,200) ctx.arc(140.7,200,5,0,2*Math.PI) // 设x=350,求右边直线的y点 180.16 ctx.moveTo(350,180.16) ctx.arc(350,180.16,5,0,2*Math.PI) // 求原点坐标 ctx.moveTo(211.713,339.3166) ctx.arc(211.713,339.3166,5,0,2*Math.PI) ctx.fillStyle = 'red'; ctx.fill(); // 标记点的坐标 ctx.font='14px Arial' ctx.beginPath() ctx.fillText("(x0,y0)",140.7+5,200+5) ctx.fillText("(x1,y1)",211.713+5,339.3166+5) ctx.fillText("(x2,y2)",350+5,180.16+5) // 编写arcTo ctx.beginPath() ctx.lineWidth=3; ctx.moveTo(140.7,200) ctx.arcTo(211.713,339.3166,350,180.16,100) ctx.stroke()这种辅助线有点复杂.那我们可以用简单点的直线辅助线
相信大家已经很熟练了,直接上代码吧
  ctx.strokeStyle = '#eee';
  ctx.stroke();
  // lines
  ctx.strokeStyle = 'gray';
  ctx.lineWidth = 1;
  ctx.beginPath()
  ctx.moveTo(81, 24)
  ctx.lineTo(81, 400)
  ctx.moveTo(400, 300)
  ctx.lineTo(40, 300)
  ctx.stroke();
  // 原点
  ctx.beginPath()
  ctx.moveTo(81, 200)
  ctx.arc(81, 200, 5, 0, 2 * Math.PI)

  ctx.moveTo(220, 300)
  ctx.arc(220, 300, 5, 0, 2 * Math.PI)
  // 求原点坐标
  ctx.moveTo(81, 300)
  ctx.arc(81, 300, 5, 0, 2 * Math.PI)
  ctx.fillStyle = 'red';
  ctx.fill();
  // 标记点的坐标
  ctx.font = '14px Arial'
  ctx.beginPath()
  ctx.fillText("(x0,y0)", 81 + 5, 200 + 5)
  ctx.fillText("(x1,y1)", 81 + 5, 300 + 5)
  ctx.fillText("(x2,y2)", 220 + 5, 300 + 5)
  // 编写arcTo
  ctx.beginPath()
  ctx.lineWidth = 3;
  ctx.moveTo(81, 200)
  ctx.arcTo(81, 300, 220, 300, 100)
  ctx.stroke()