Seaborn入门
Seaborn是基于matplotlib的python数据可视化库,提供更高层次的API封装,使用起来更加方便快捷。
displot
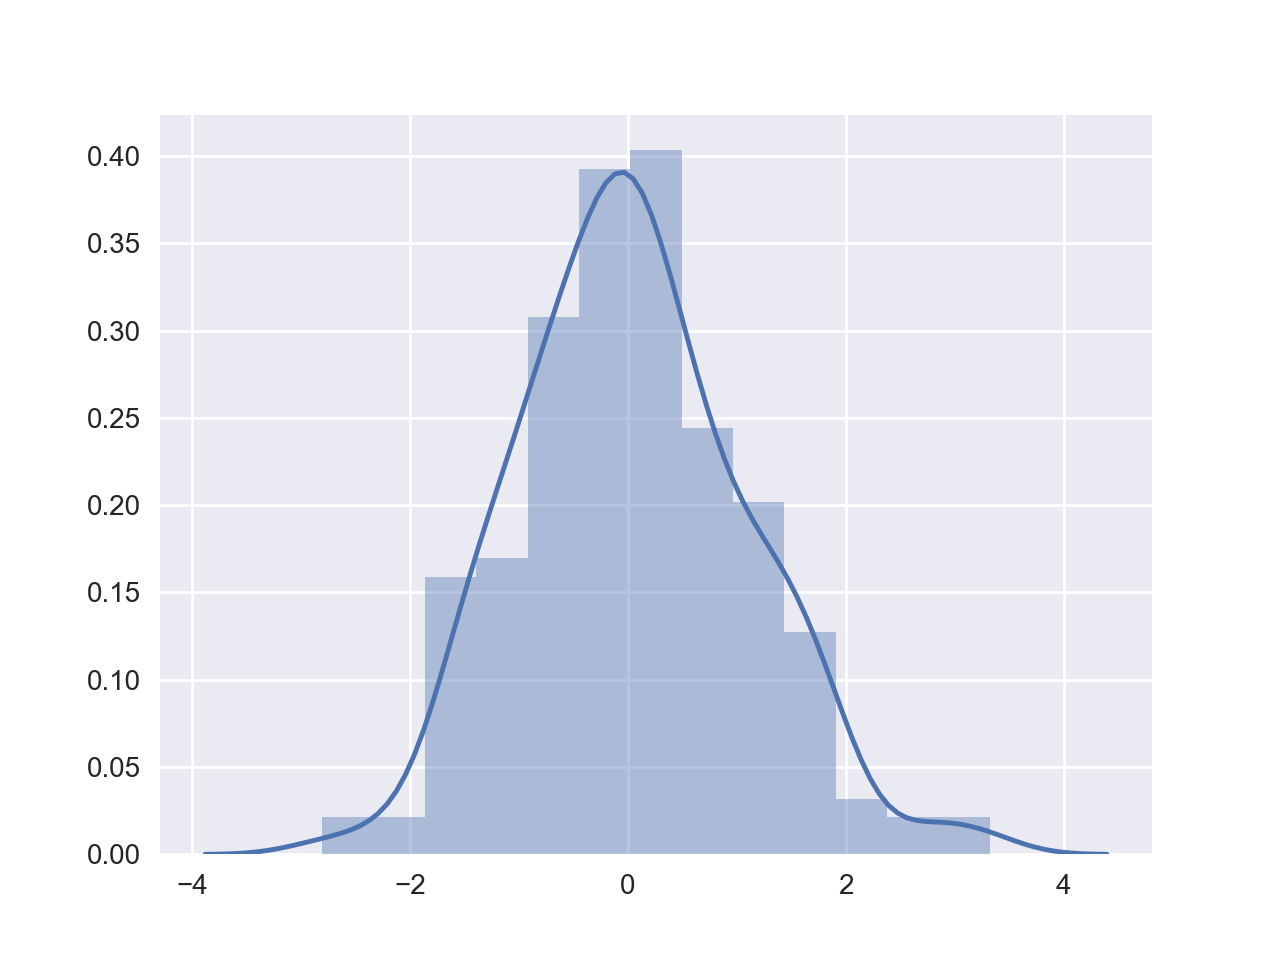
displot()集成了hist直方图和kde核函数估计的功能,函数如下:
seaborn.distplot(a, bins=None, hist=True, kde=True, rug=False, fit=None, hist_kws=None, kde_kws=None, rug_kws=None, fit_kws=None, color=None, vertical=False, norm_hist=False, axlabel=None, label=None, ax=None)
'''
a:Series, 1d-array or list. 数据来源
bins:矩形图数量
hist:是否显示直方图
kde:是否显示核函数估计图
rug:控制是否显示观察的边际毛毯
fit:控制拟合的参数分布图形
vertical:显示正交控制
'''
#例
In [41]: x = np.random.normal(size=200)

In [42]: sns.distplot(x)
Out[42]: <matplotlib.axes._subplots.AxesSubplot at 0x11aa43490>

In [43]: plt.show()
barplot与countplot
barplot描述某种变量分布的平均值
seaborn.barplot(x=None, y=None, hue=None, data=None, order=None, hue_order=None,ci=95, n_boot=1000, units=None, orient=None, color=None, palette=None, saturation=0.75, errcolor='.26', errwidth=None, capsize=None, ax=None, estimator=<function mean>,**kwargs)
'''
x, y, hue:设置x,y以及颜色控制的变量
data:输入的数据集
order, hue_order:控制变量绘图的顺序
estimator:设置对每类变量的计算函数,默认为平均值,可修改为max、median、max等
ax:设置子图位置
orient:"v"|"h",控制绘图的方向,水平或者竖直
capsize:设置误差棒帽条的宽度
'''
#例
In [58]: tips = sns.load_dataset("tips") #载入自带数据集

In [59]: ax = sns.barplot(x="day", y="total_bill", hue="sex", data=tips)

In [60]: plt.show()

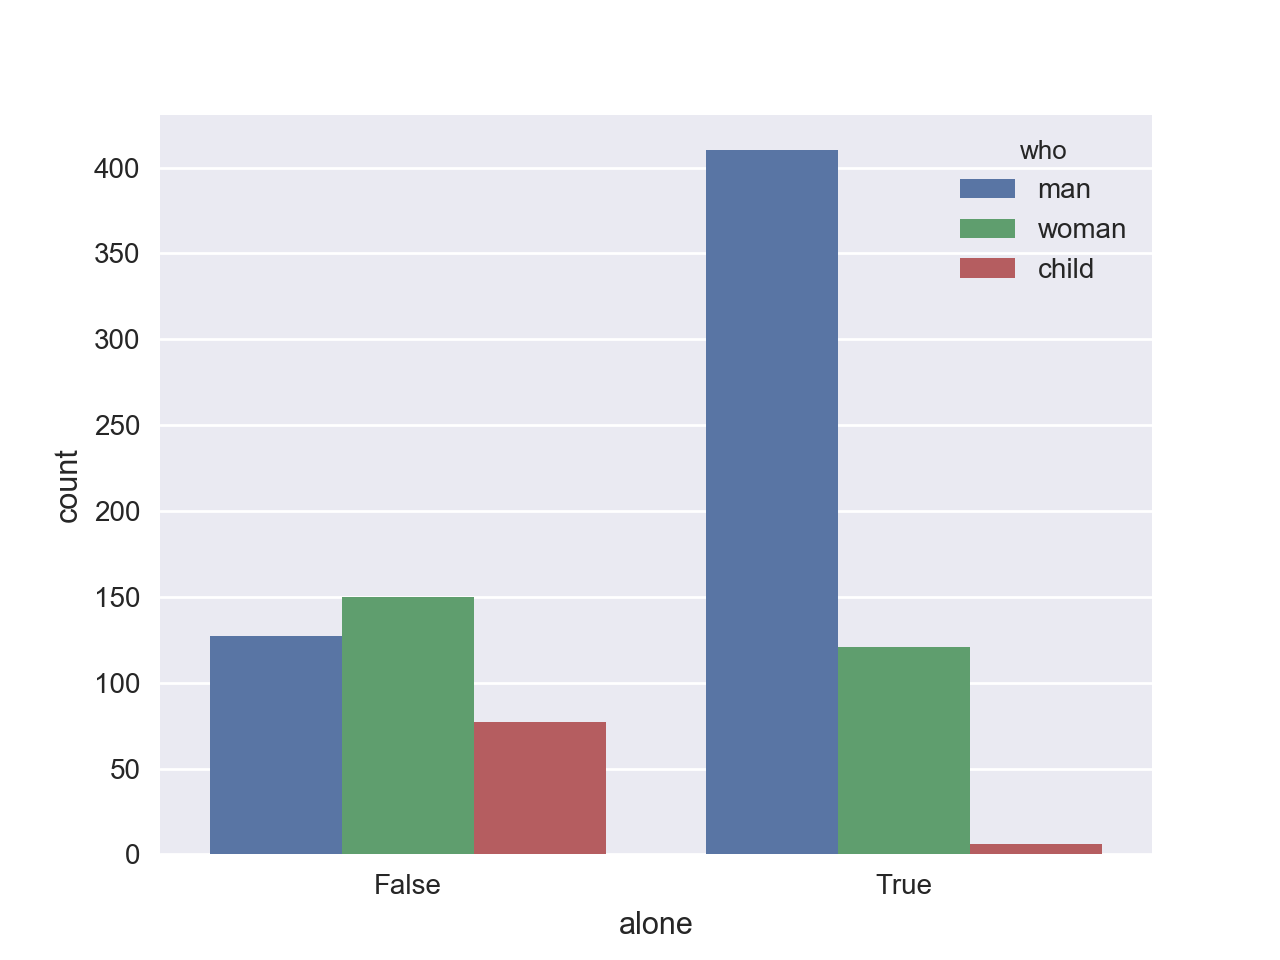
countplot用来计数
seaborn.countplot(x=None, y=None, hue=None, data=None, order=None, hue_order=None, orient=None, color=None, palette=None, saturation=0.75, ax=None, **kwargs)
'''
设置方法跟barplot类似
'''
#例
In [68]: titanic = sns.load_dataset("titanic")

In [69]: sns.countplot(x="alone", hue="who", data=titanic)
Out[69]: <matplotlib.axes._subplots.AxesSubplot at 0x126b82590>

In [70]: plt.show()
boxplot与violinplot
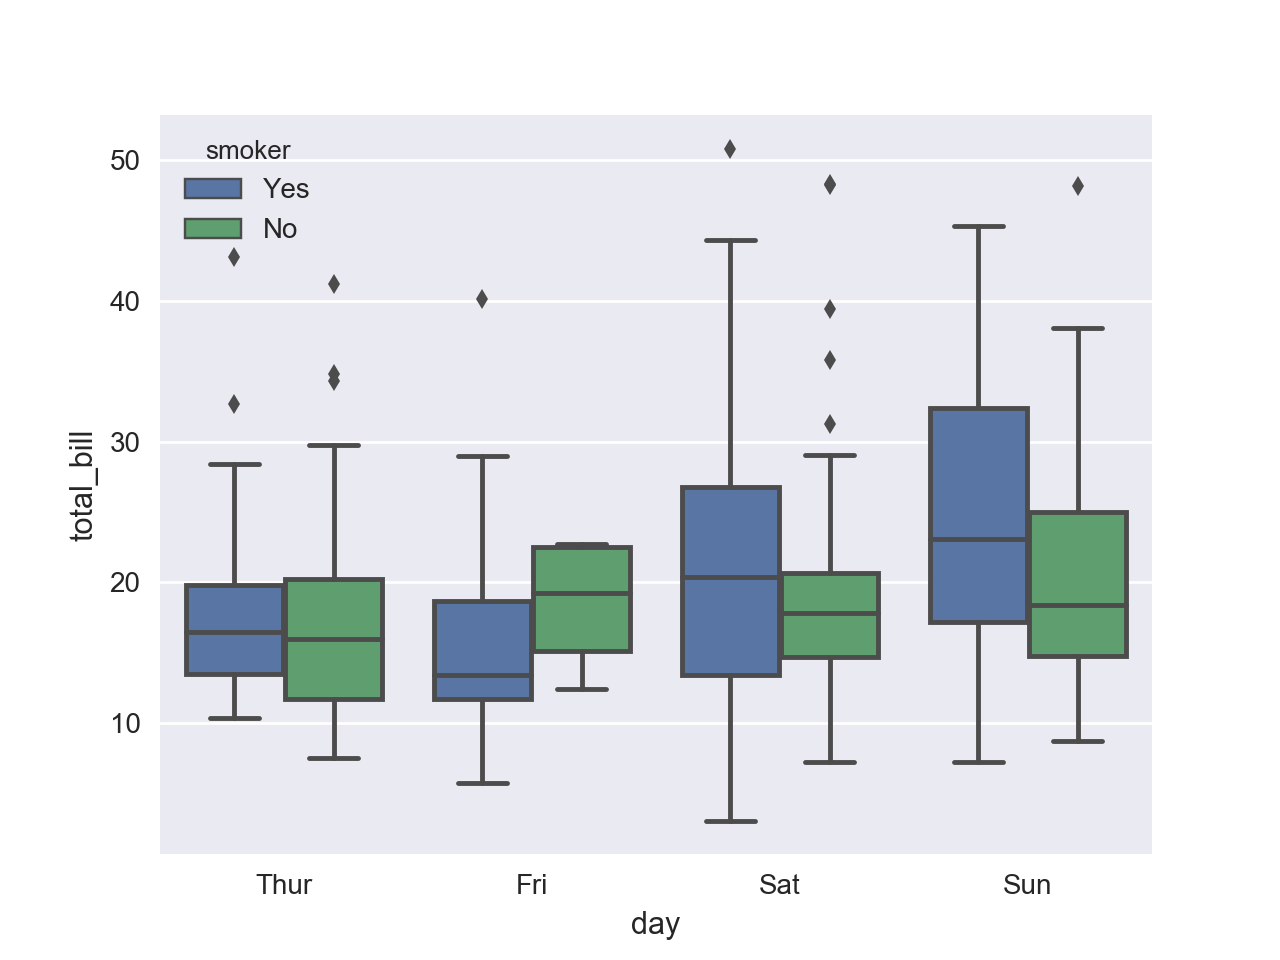
箱式图
可以表示数据的位置及分散情况,还能区分异常点
seaborn.boxplot(x=None, y=None, hue=None, data=None, order=None, hue_order=None, orient=None, color=None, palette=None, saturation=0.75, width=0.8, fliersize=5, linewidth=None, whis=1.5, notch=False, ax=None, **kwargs)
'''
参数与前面一致
'''
#例
In [76]:sns.boxplot(x="day", y="total_bill", hue="smoker",data=tips)

In [77]:plt.show() #外面的点为异常点
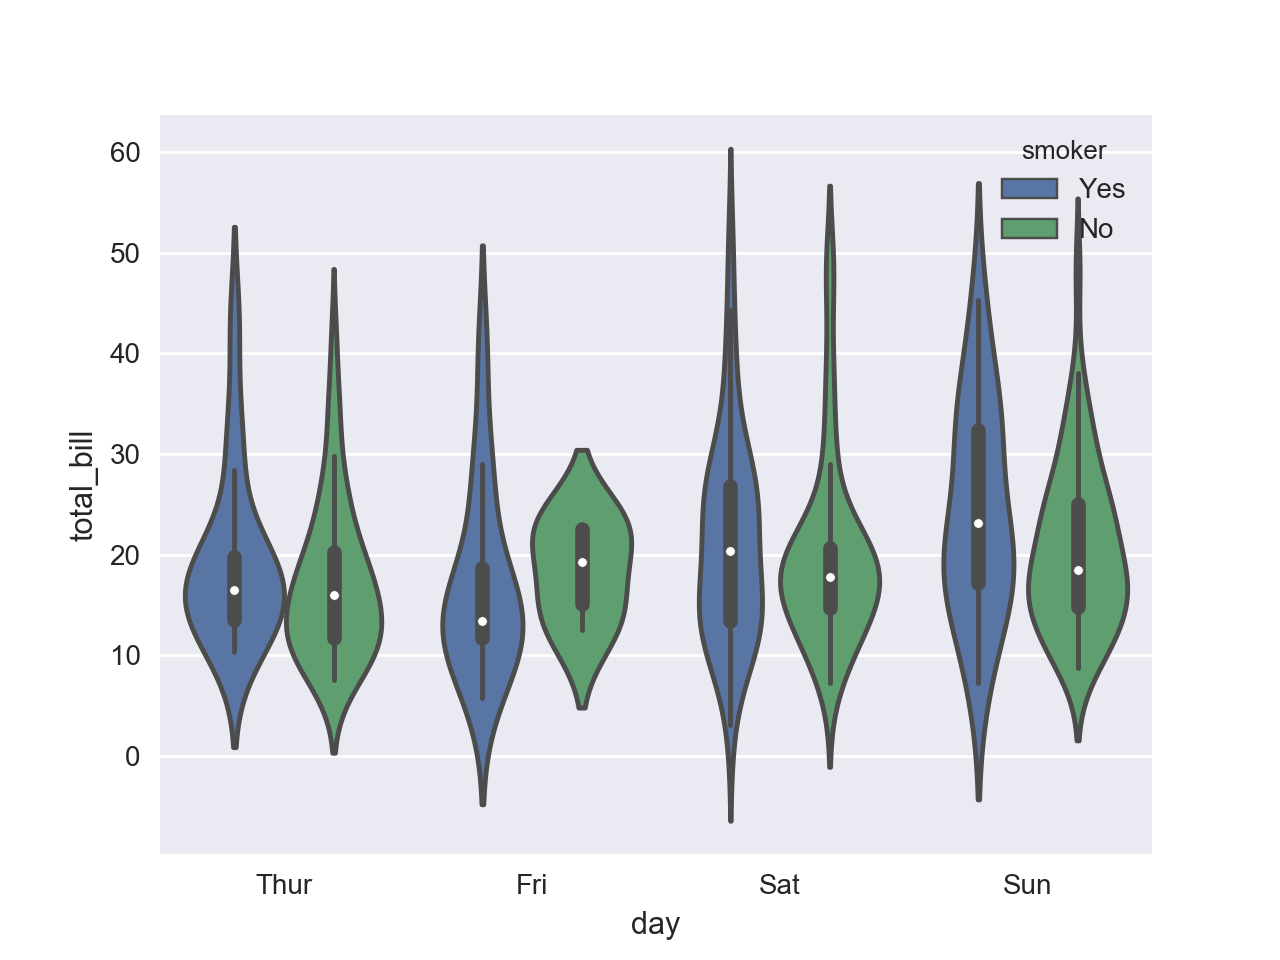
琴式图
琴式图的信息量更大,还加上了概率分布
sns.violinplot(x="day", y="total_bill", hue="smoker",data=tips)
线性回归模型
implot是一种集合基础绘图与基于数据建立回归模型的绘图方法。旨在创建一个方便拟合数据集回归模型的绘图方法,利用'hue'、'col'、'row'参数来控制绘图变量。
seaborn.lmplot(x, y, data, hue=None, col=None, row=None, palette=None, col_wrap=None, size=5, aspect=1, markers='o', sharex=True, sharey=True, hue_order=None, col_order=None, row_order=None, legend=True, legend_out=True, x_estimator=None, x_bins=None, x_ci='ci', scatter=True, fit_reg=True, ci=95, n_boot=1000, units=None, order=1, logistic=False, lowess=False, robust=False, logx=False, x_partial=None, y_partial=None, truncate=False, x_jitter=None, y_jitter=None, scatter_kws=None, line_kws=None)
'''
hue, col, row:strings 定义数据子集的变量,并在不同的图像子集中绘制
size:scalar 定义子图的高度
markers:定义散点的图标
col_wrap:设置每行子图数量
order:多项式回归,设定指数,可以用多项式拟合
logistic:逻辑回归
logx:转化为log(x)
'''
#例
sns.lmplot(x="total_bill", y="tip", col="day", hue="day",data=tips, col_wrap=2, size=3)

小结
Seaborn简洁而强大,和pandas、numpy组合使用效果更佳,以上介绍了一些常用功能,其他的就即用即查吧。
值得注意的是,Seaborn并不是matplotlib的代替品,很多时候仍然需要使用matplotlib的。