Sampling and Estimation
Sampling Error
Sampling error is the difference between a sample statistic(the mean, variance, or standard deviation of the sample) and its corresponding population parameter(the true mean, variance, or standard deviation of the population).
For example, the sampling error for the mean is as follows:
sampling errors of the mean = sample mean - population mean = x-μ
Simple Random Sampling
Simple random sampling is a method of selecting a sample in such a way that each item or person in the population being studied has the same likelihood of being included in the sample.
Stratified Random Sampling (分层抽样)
Stratified random sampling uses a classification system to separate the population into smaller groups based on one or more distinguishing characteristics. From each subgroup, or stratum, a random sample is taken and the results are pooled. The size of the samples from each stratum is based on the size of the stratum relative to the population.
Sampling Distribution
It is important to recognize that the sample statistic itself is a random variable and, therefore, has a probability distribution. The sampling distribution of the sample statistic is a probability distribution of all possible sample statistics computed from a set of equal-size samples that were randomly drawn from the same population.
Central Limit Theorem (中心极限定理)
The central limit theorem states that for simple random samples of size n from a population with a mean μ and a finite variance σ^2, the sampling distribution of the sample mean x approaches a normal probability distribution with mean μ and a variance equal to (σ^2/n) as the sample size becomes large.
The central limit theorem is extremely useful because the normal distribution is relatively easy to apply to hypothesis testing and to the construction of confidence intervals. Specific inferences about the population mean can be made from the sample mean, regardless of the population's distribution, as long as the sample size if "sufficiently large" which usually means n>=30.
Important properties of the central limit theorem include the following:
- If the sample size n is sufficiently large (n>=30), the sampling distribution of the sample means will be approximately normal. Remember what's going on here, random samples of size n are repeatedly being taken from an overall larger population. Each of these random samples has its own mean, which is itself a random variable, and this set of sample means has a distribution that is approximately normal.
- The mean of the population, μ, and the mean of the distribution of all possible sample means are equal.
- The variance of the distribution of sample means is (σ^2/n), the population variance divided by the sample size.
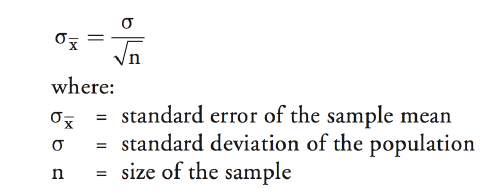
Standard Error (标准误差)
The standard error of the sample mean is the standard deviation of the distribution of the sample means.
When the standard deviation of the population, σ, is known,, the standard error of the sample mean is calculated as σ/(n^0.5)
Practically speaking, the population's standard deviation is almost never known. Instead, the standard error of the sample mean must be estimated by dividing the standard deviation of the sample mean by n^0.5 - s/(n^0.5)

Point Estimate (点估计) and Confidence Interval(置信区间)
Point estimates are single (sample) values used to estimate population parameters. The formula used to compute the point estimate is called the estimator. For example, the sample mean, x, is an estimator of the population mean μ and is computed as (∑X)/n
The value generated with this calculation for a given sample is called the point estimate of the mean.
A confidence interval is a range of values in which the population parameter is expected to lie.
Student's t-distribution
Student's t-distribution, or simply the t-distribution, is a bell-shaped probability distribution that is symmetrical about its mean. It is the appropriate distribution to use when constructing confidence intervals based on small samples (n<30) from populations with unknown variance and a normal, or approximately normal, distribution.
It may also be appropriate to use the t-distribution when the population variance is unknown and the sample size is large enough that the central limit theorem assure that the sampling distribution is approximately normal.
t-distribution has the following properties:
- It's symmetrical
- It is defined by a single parameter, the degree of freedom(df), where the degrees of freedom are equal to the number of sample observations minus 1, n-1, for sample means.
- It has more probability in the tails ("fatter tails") than the normal distribution.
- As the degree of freedom (the sample size) gets larger, the shape of the t-distribution more closely approaches a standard normal distribution.
The degree of freedom for tests based on sample means are n-1 because, given the mean, only n-1 observations can be unique.
As the number of degrees of freedom increases without bound, the t-distribution converges to the standard normal distribution (z-distribution). The thickness of the tails relative to those of the z-distribution is important in hypothesis testing because thicker tails mean more observations away from the center of the distribution (more outliers). Hence, hypothesis testing using the t-distribution makes it more difficult to reject null relative to hypothesis testing using the z-distribution.

Confidence Interval
Confidence interval estimates result in a range of values within which the actual value of a parameter will lie, given the probability of 1-α. Here, alpha, α, is called the level of significance for the confidence interval, and the probability 1-α is referred to as the degree of confidence.
Confidence intervals are usually constructed by adding or subtracting an appropriate value from the point estimate. In general, confidence intervals take on the following form:
point estimate +/- (reliability factor * standard error)
- point estimate = value of a sample statistic of the population parameter
- reliability factor = number that depends on the sampling distribution of the point estimate and the probability that the point estimate falls in the confidence interval, 1-α
- standard error = standard error of the point estimate
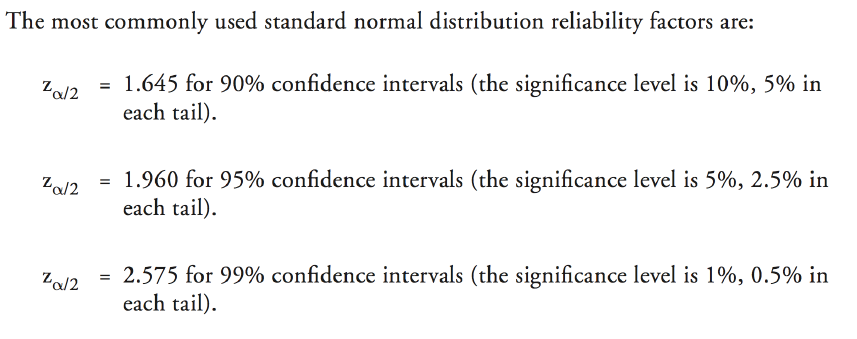
If the population has a normal distribution with a known variance, a confidence interval for the population mean can be calculated as:

If the distribution of the population is normal with unknown variance, we can use t-distribution to construct a confidence interval:

Unlike the standard normal distribution, the reliability factors for the t-distribution depend on the sample size, so we cannot rely on a commonly used set of reliability factors. Instead, reliability factors for the t-distribution have to be looked up in a table of Student's t-distribution.
Owing to the relatively fatter tails of the t-distribution, confidence intervals constructed using t-reliability factors will be more conservative(wider) than those constructed using z-reliability factors.
If the distribution is nonnormal but the the population variance is known, the z-statistic can be used as long as the sample size is large(n>=30).
We can do this because the central limit theorem assures us that the distribution of the sample mean is approximately normal when the sample is large.
If the distribution is nonnormal and the population variance is unknown, the t-statistic can be used as long as the sample size is large(n>=30).
It is also acceptable to use the z-statistic, although use of the t-statistic is more conservative.
If we are sampling from a nonnormal distribution (which is sometimes the case in finance), we cannot create a confidence interval if the sample size is less than 30.
So, all else equal, make sure you have a sample of at least 30, and the larger, the better.
