一.Matplotlib介绍
Matplotlib是一个Python的2D绘图库,它以各种硬拷贝格式和跨平台的交互式环境生成出版质量级别的图形。通过Matplotlib,开发者可以仅需要几行代码,便可以生成绘图,折线图、散点图、柱状图、饼图、直方图、子图等。Matplotlib使用NumPy进行数组运算,并调用一系列其他的Python库来实现硬件交互。
二.绘图示例
环境:Python(3.5.2)、Jupyter(1.0.0) Ubuntu安装Jupyter Notebook
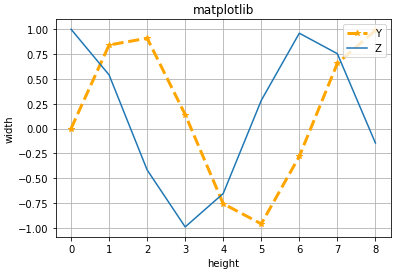
1.折线图
%matplotlib inline

import matplotlib.pyplot as plt
import numpy as np

x = np.arange(9)
y = np.sin(x)
z = np.cos(x)
# marker数据点样式,linewidth线宽,linestyle线型样式,color颜色
plt.plot(x, y, marker="*", linewidth=3, linestyle="--", color="orange")
plt.plot(x, z)
plt.title("matplotlib")
plt.xlabel("height")
plt.ylabel("width")
# 设置图例
plt.legend(["Y","Z"], loc="upper right")
plt.grid(True)
plt.show()
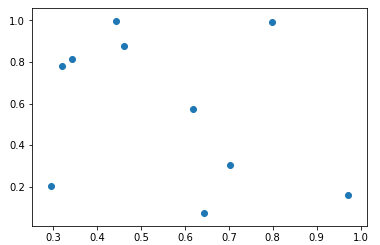
2.散点图
x = np.random.rand(10)
y = np.random.rand(10)
plt.scatter(x,y)
plt.show()
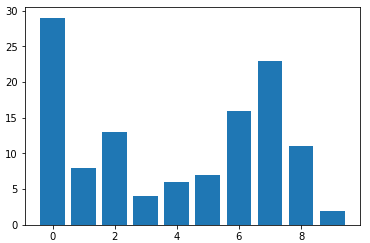
3.柱状图
x = np.arange(10)
y = np.random.randint(0,30,10)
plt.bar(x, y)
plt.show()
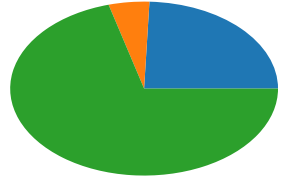
4.饼图
x = np.random.randint(1, 10, 3)
plt.pie(x)
plt.show()
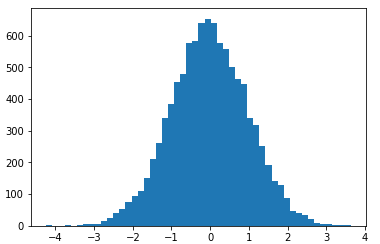
5.直方图
mean, sigma = 0, 1
x = mean + sigma * np.random.randn(10000)
plt.hist(x,50)
plt.show()
6.子图
# figsize绘图对象的宽度和高度,单位为英寸,dpi绘图对象的分辨率,即每英寸多少个像素,缺省值为80
plt.figure(figsize=(8,6),dpi=100)

# subplot(numRows, numCols, plotNum)
# 一个Figure对象可以包含多个子图Axes,subplot将整个绘图区域等分为numRows行*numCols列个子区域,按照从左到右,从上到下的顺序对每个子区域进行编号
# subplot在plotNum指定的区域中创建一个子图Axes
A = plt.subplot(2,2,1)
plt.plot([0,1],[0,1], color="red")

plt.subplot(2,2,2)
plt.title("B")
plt.plot([0,1],[0,1], color="green")

plt.subplot(2,1,2)
plt.title("C")
plt.plot(np.arange(10), np.random.rand(10), color="orange")

# 选择子图A
plt.sca(A)
plt.title("A")

plt.show()

三.自定义X轴刻度
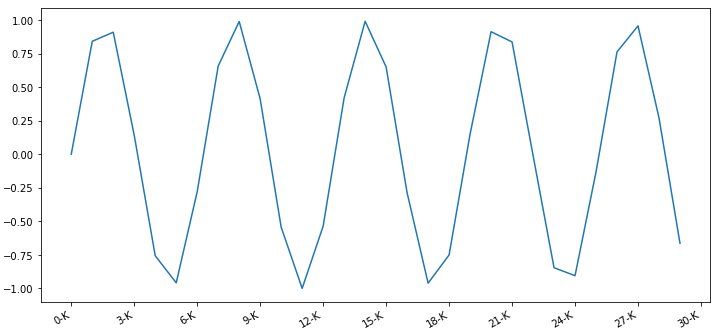
1.数字格式
%matplotlib inline

import matplotlib.pyplot as plt
import numpy as np
from matplotlib.ticker import MultipleLocator, FormatStrFormatter

x = np.arange(30)
y = np.sin(x)
plt.figure(figsize=(12,6))
plt.plot(x, y)
# 设置X轴的刻度间隔
plt.gca().xaxis.set_major_locator(MultipleLocator(3))
# 设置X轴的刻度显示格式
plt.gca().xaxis.set_major_formatter(FormatStrFormatter("%d-K"))
# 自动旋转X轴的刻度,适应坐标轴
plt.gcf().autofmt_xdate()
plt.show()
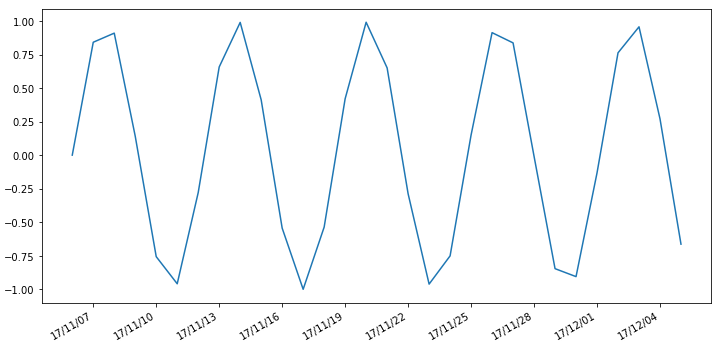
2.时间格式
%matplotlib inline

import matplotlib.pyplot as plt
import numpy as np
import datetime
from matplotlib.dates import DayLocator, DateFormatter

x = [datetime.date.today() + datetime.timedelta(i) for i in range(30)]
y = np.sin(np.arange(30))
plt.figure(figsize=(12,6))
plt.plot(x, y)
# 设置X轴的时间间隔,MinuteLocator、HourLocator、DayLocator、WeekdayLocator、MonthLocator、YearLocator
plt.gca().xaxis.set_major_locator(DayLocator(interval=3))
# 设置X轴的时间显示格式
plt.gca().xaxis.set_major_formatter(DateFormatter('%y/%m/%d'))
# 自动旋转X轴的刻度,适应坐标轴
plt.gcf().autofmt_xdate()
plt.show()