本文完整代码及数据已上传至我的
Github仓库https://github.com/CNFeffery/FefferyViz
1 简介
我们经常会在一些PPT报告或者宣传广告中看到一些比较抽象的地图,它们都是在正常地图的基础上,通过置换几何元素,来实现出较为抽象的效果,这类的作品非常之多,因此本文不模仿实际的某幅作品,而是制作出下面三类抽象地图:

2 基于Python模仿常见抽象地图
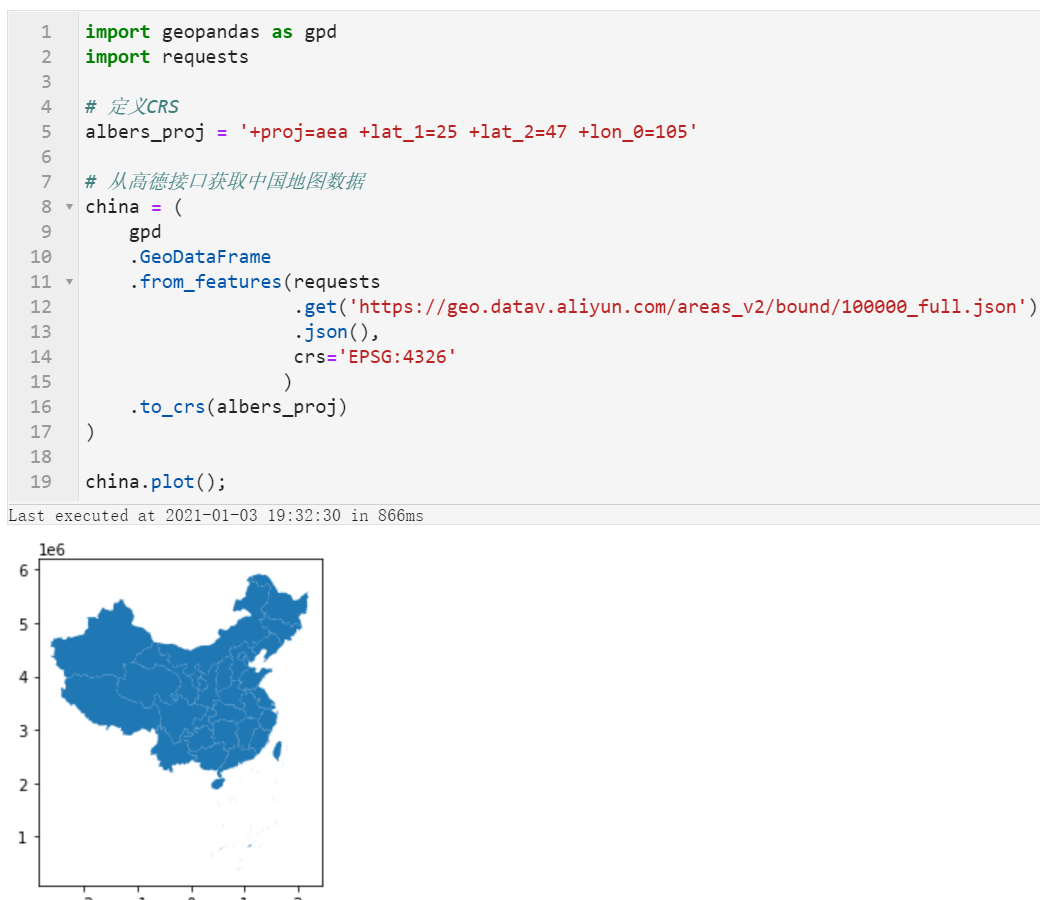
对应图1,我们下面来分别模仿3类抽象地图,首先准备一下要用到的中国地图数据,我们偷个懒直接使用高德开源的地图数据接口:
为了方便和简化之后的运算,我们利用unary_union来将融合所有要素为一个:
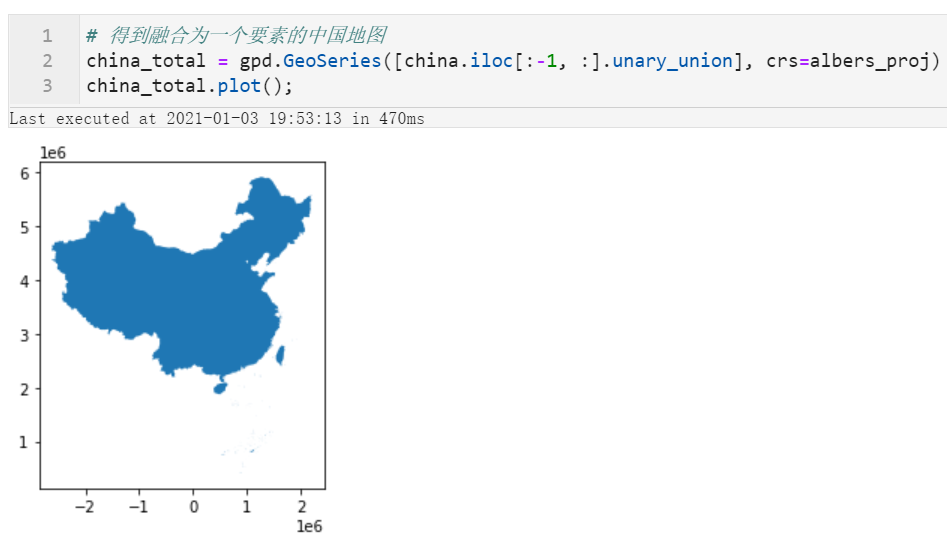
这样我们的基础数据就准备好了~
2.1 向外环形扩散的地图
首先我们来制作图1左图所示,从以某个点为圆心,向外环形扩散的地图,原理其实很简单,只需要定义圆心坐标,接着向外按照等差数列,依次扩大半径距离计算缓冲区的轮廓线:
from shapely.geometry import Point
import matplotlib.pyplot as plt

fig, ax = plt.subplots(figsize=(8, 8))

# 以重庆为圆心,生成向外的环形线,间隔为80公里
center = gpd.GeoSeries([Point((106.546737, 29.566598))], crs='EPSG:4326').to_crs(albers_proj)
circles = gpd.GeoSeries([center[0].buffer(i*1000*80).boundary for i in range(1, 45)], crs=albers_proj)

ax = china_total.plot(ax=ax, facecolor='none', edgecolor='black')
ax = circles.plot(ax=ax)
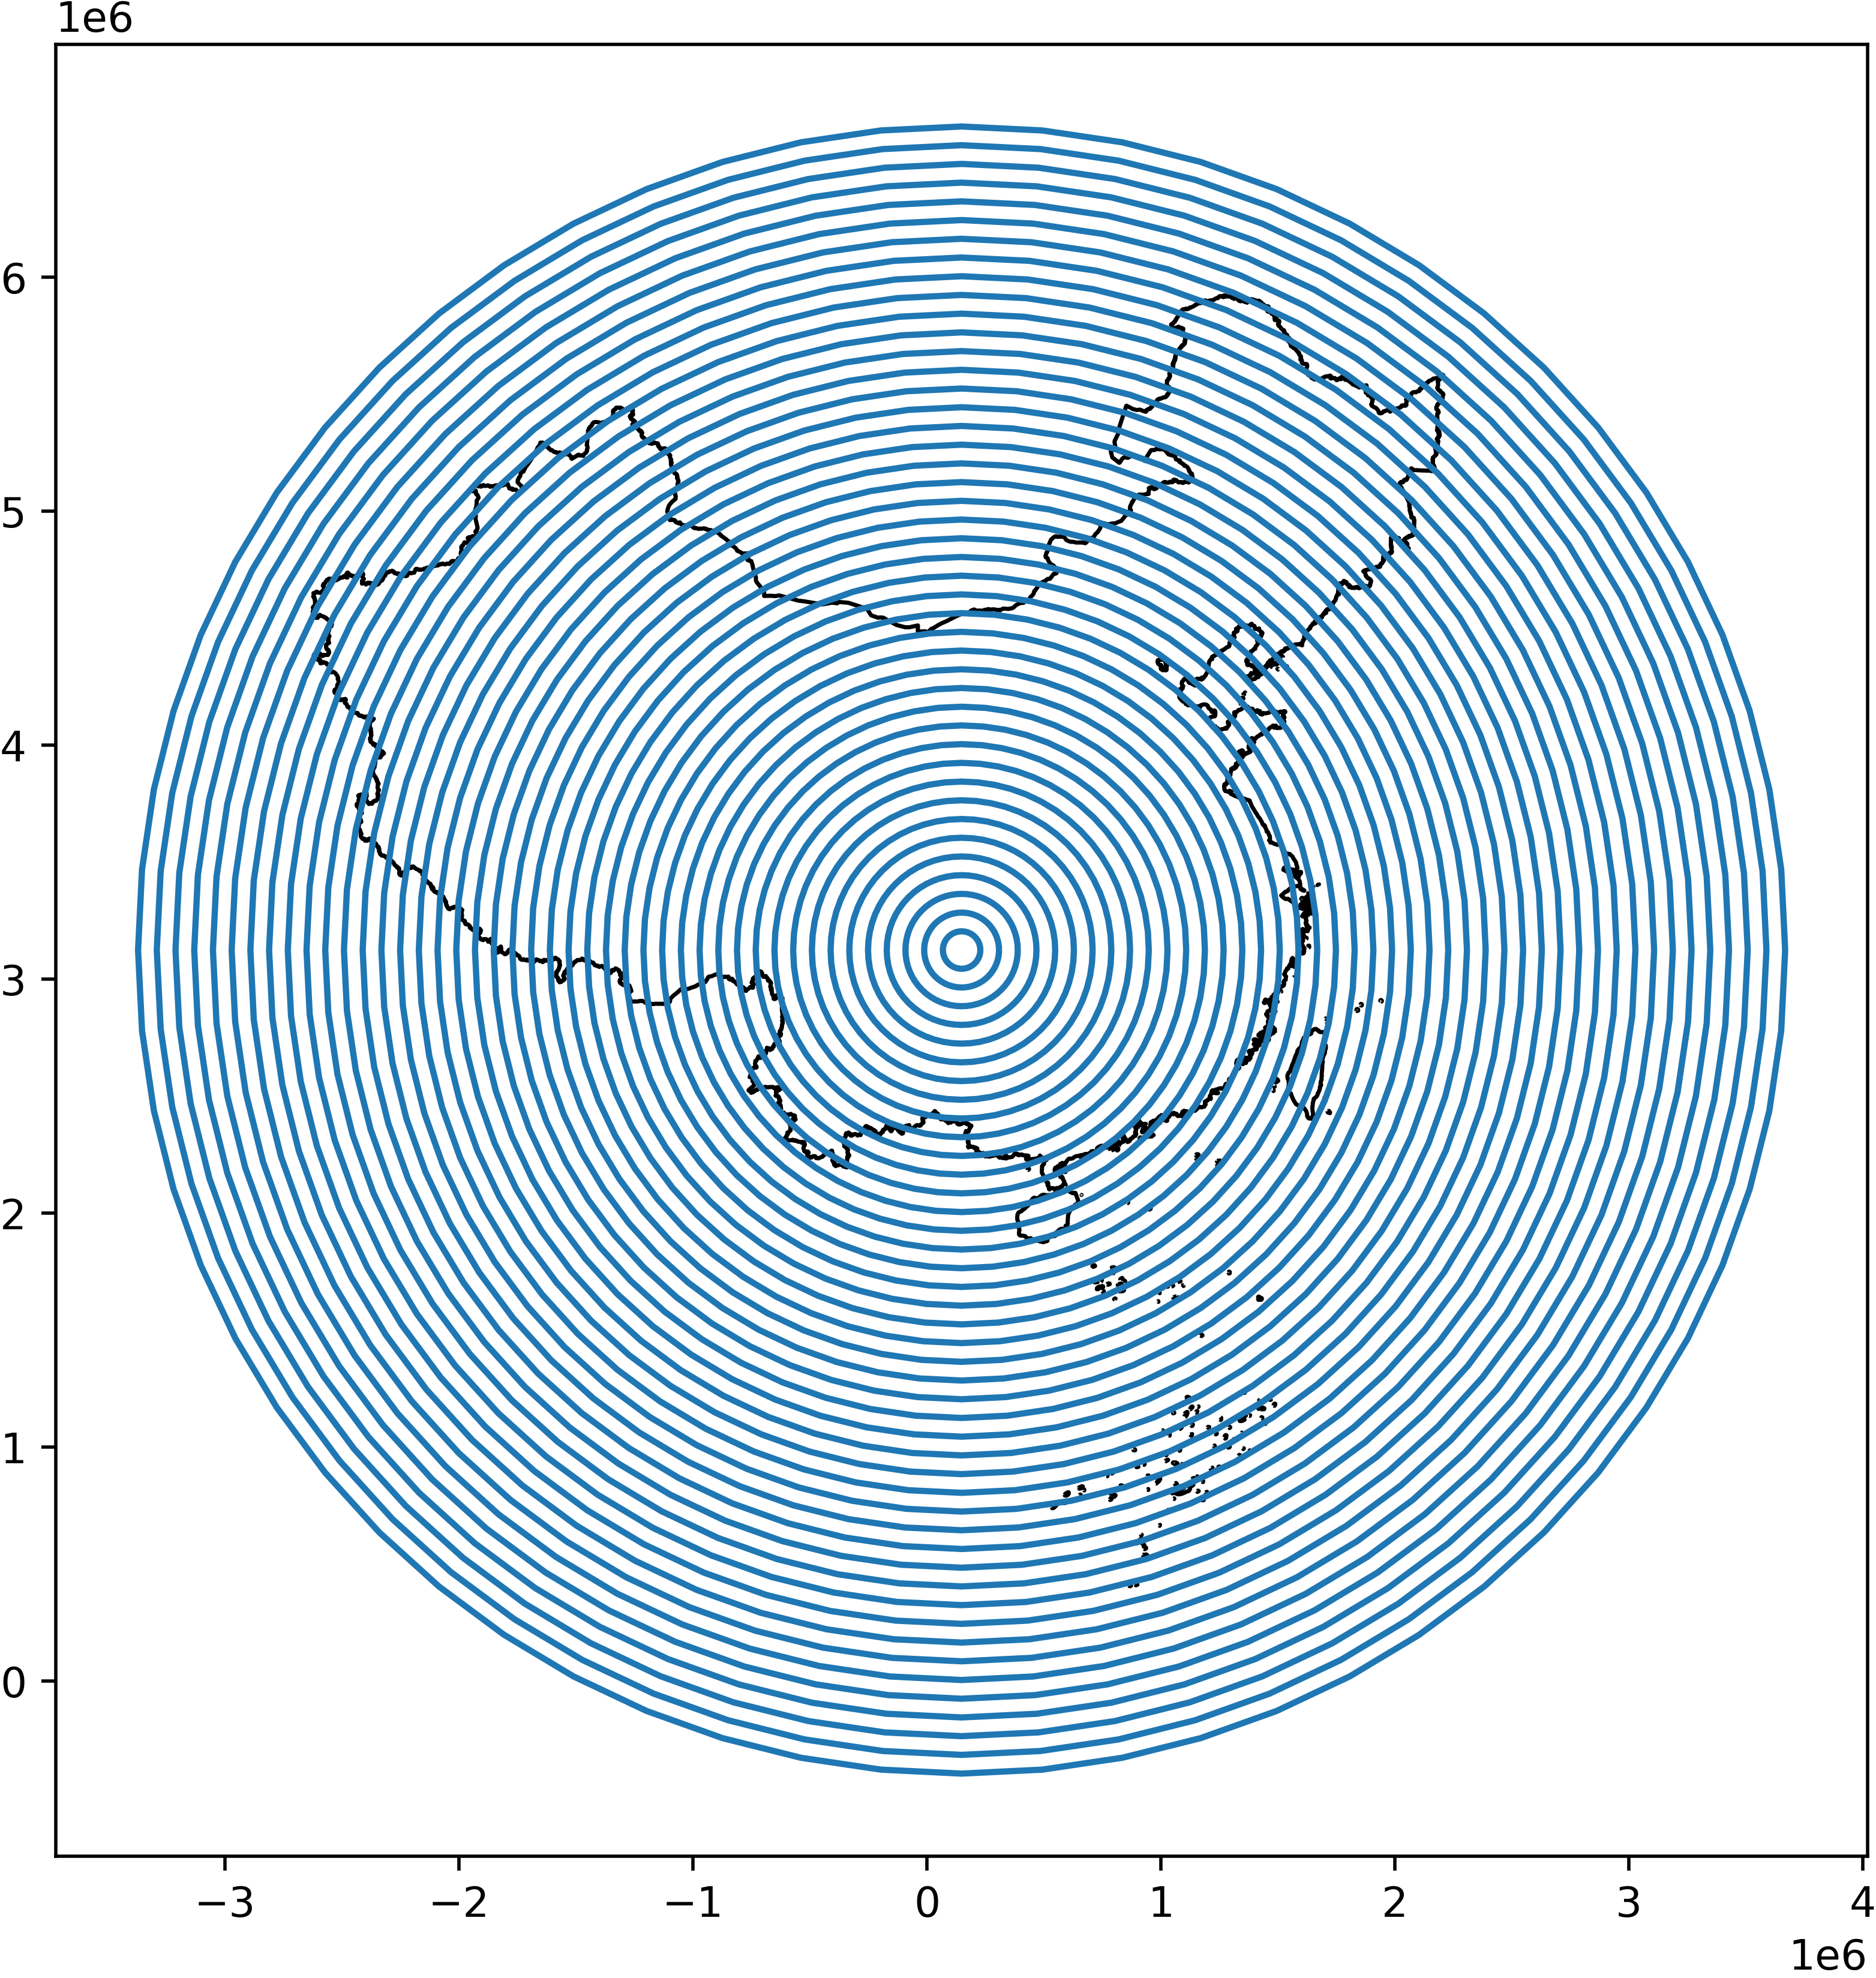
可以看到目前生成的环形线已经可以覆盖中国全境,最后用china_total来裁剪即可:
fig, ax = plt.subplots(figsize=(8, 8))

# 用china_total作为蒙版从circles中裁切出绘图所需部分
ax = gpd.clip(circles, mask=china_total).plot(ax=ax, color='white')

ax.set_facecolor('#4a4db7')

fig.set_facecolor('#4a4db7')

ax.set_xticks([])
ax.set_yticks([])

ax.spines['left'].set_color('none')
ax.spines['top'].set_color('none')
ax.spines['right'].set_color('none')
ax.spines['bottom'].set_color('none')

fig.savefig('图5.png', dpi=500, bbox_inches='tight', pad_inches=0)

在这幅图的基础上,你就可以添加其他的文字标注等元素,形成配图,使得你的报告更加高级。
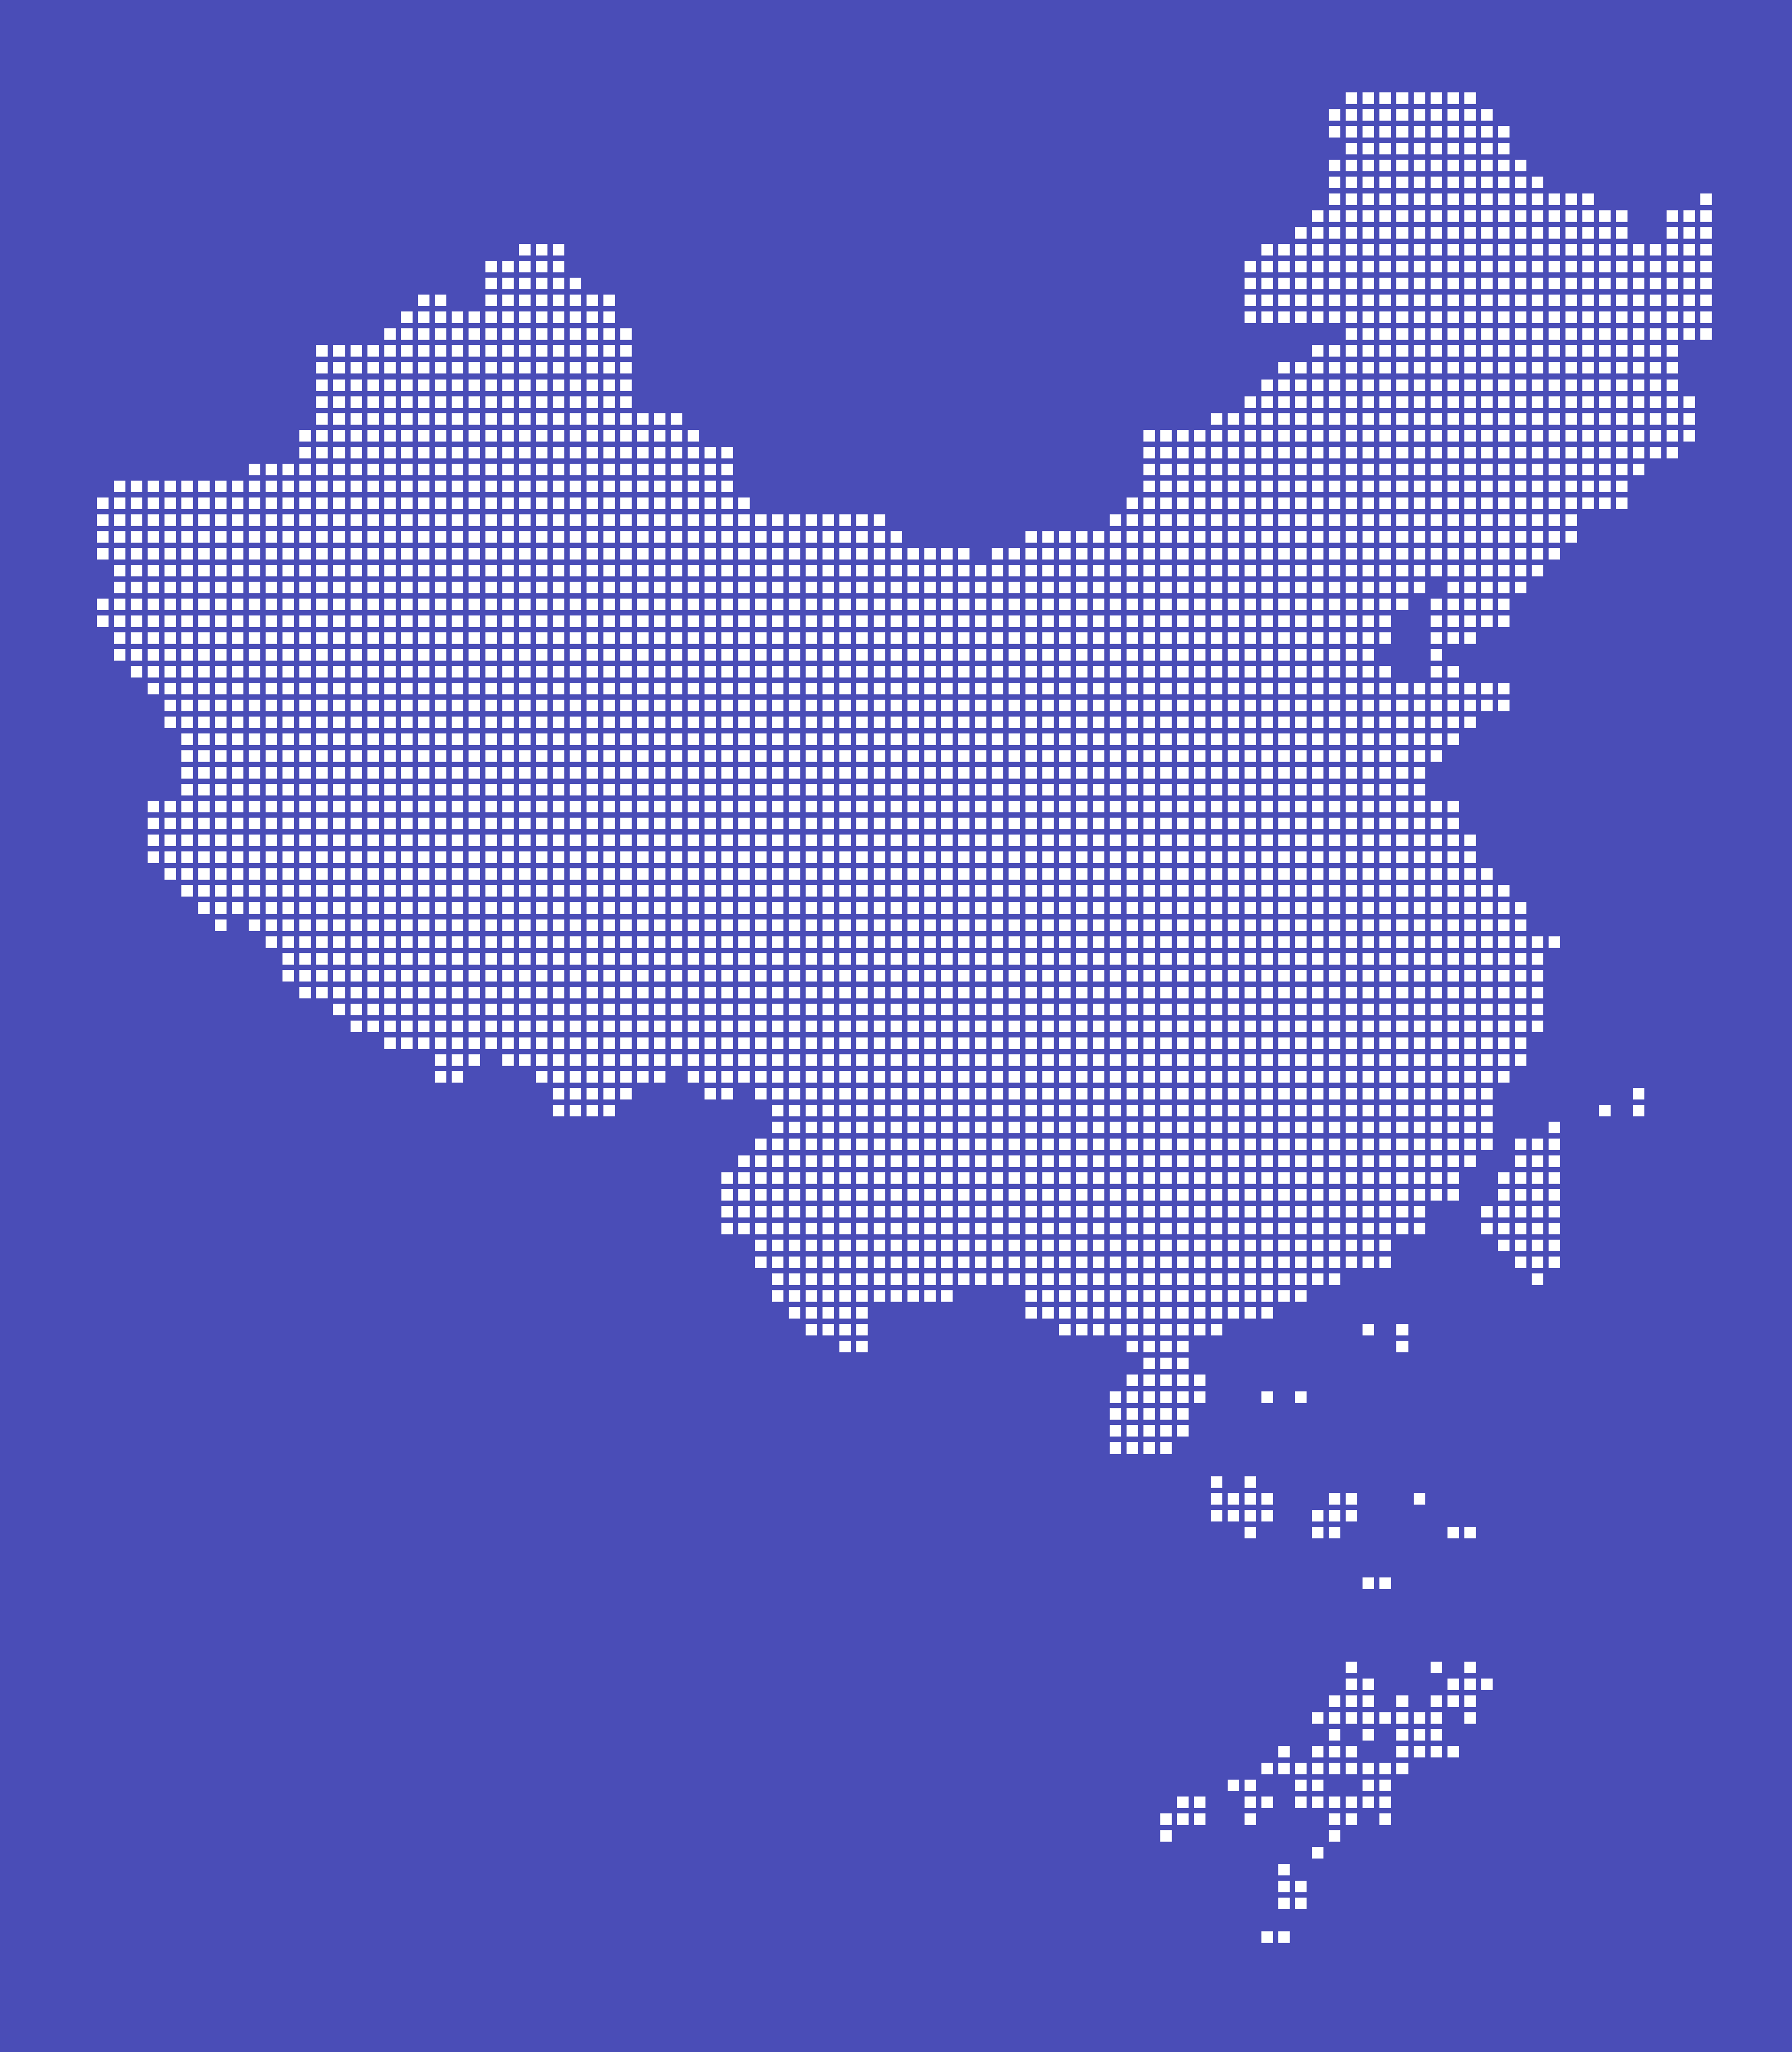
2.2 像素风格地图
接着我们来制作图1中图所示的又方块组成的像素风格地图,原理也很简单,生成覆盖china_total范围的网格:
from shapely.geometry import MultiLineString
from shapely.ops import polygonize # 用于将交叉线转换为网格面
import numpy as np

# 提取china_total左下角与右上角坐标
xmin, ymin, xmax, ymax = china_total.total_bounds
xmin, ymin, xmax, ymax = int(xmin), int(ymin), int(xmax), int(ymax)

# 创建x方向上的所有坐标位置,间距50公里
x = np.arange(xmin, xmax, 50*1000)

# 创建y方向上的所有坐标位置,间距50公里
y = np.arange(ymin, ymax, 50*1000)

# 生成全部交叉线坐标信息
hlines = [((x1, yi), (x2, yi)) for x1, x2 in zip(x[:-1], x[1:]) for yi in y]
vlines = [((xi, y1), (xi, y2)) for y1, y2 in zip(y[:-1], y[1:]) for xi in x]

grids = gpd.GeoSeries(list(polygonize(MultiLineString(hlines + vlines))), crs=albers_proj)
grids.plot(facecolor='none', edgecolor='black')
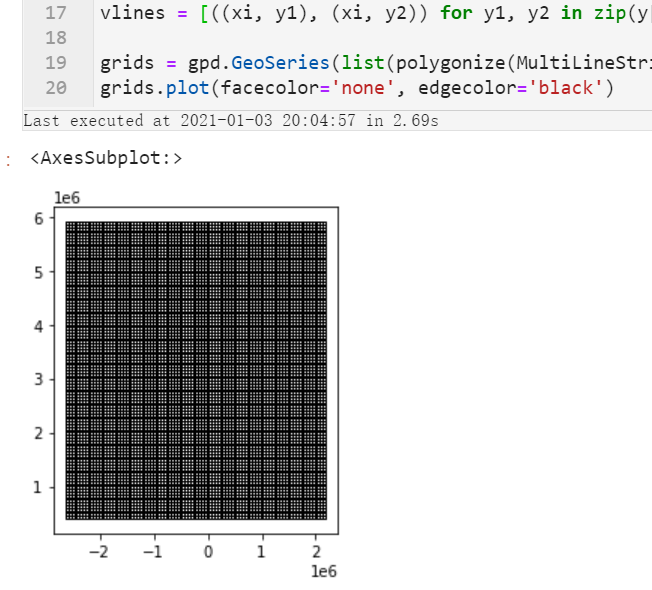
再向内缓冲一定的距离,即可得到结果:
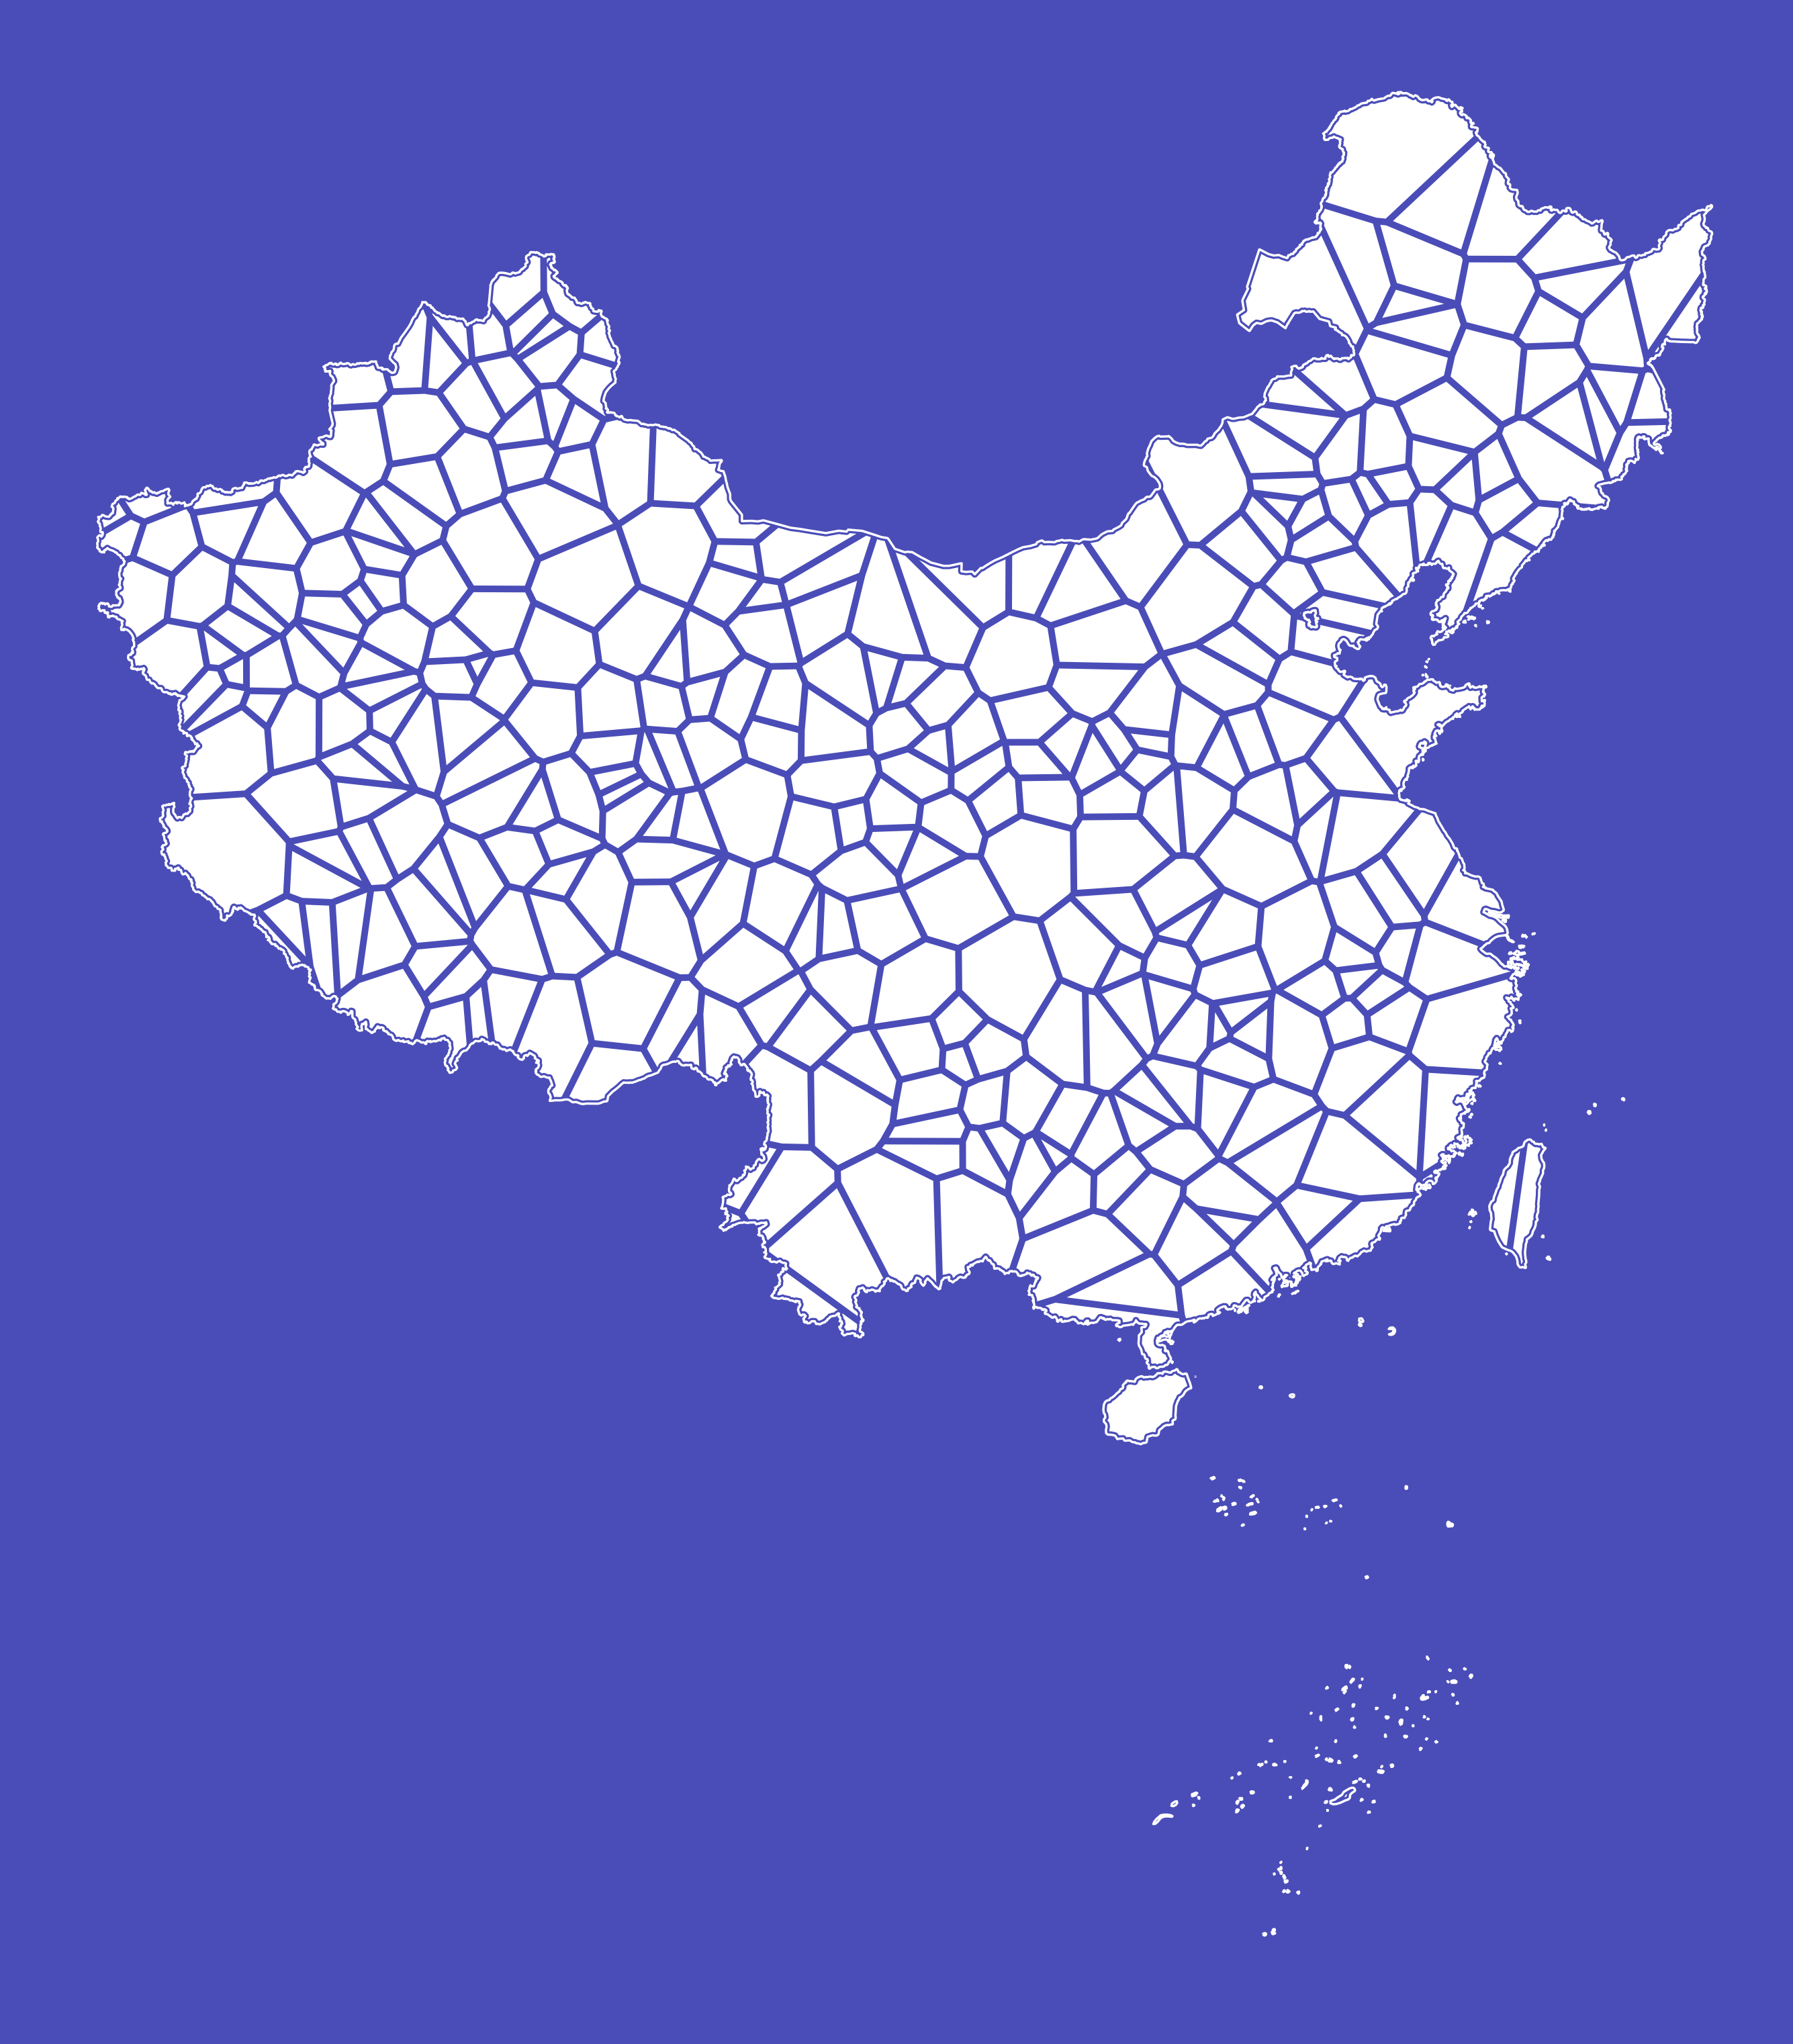
2.3 由不规则多边形拼凑的地图
最后我们来制作图1右图所示的由不规则多边形拼凑的地图,需要用到泰森多边形,我们可以通过pip install geovoronoi来安装辅助库。
因为泰森多边形需要从点出发创建多边形,因此我们可以生成目标面内部的随机散点,再作为输入来生成所需的多边形:
from geovoronoi import voronoi_regions_from_coords


np.random.seed(42)
coords = gpd.GeoSeries([Point(x, y) for x, y in zip(np.random.uniform(xmin, xmax, 1000),
                                                    np.random.uniform(ymin, ymax, 1000))],
                       crs=albers_proj)

# 得到china_total内部的散点坐标数组
coords = coords[coords.within(china_total[0])]

# 利用geovoronoi得到所需的泰森多边形,其中poly_shapes即为我们需要的多边形
poly_shapes, pts, poly_to_pt_assignments = voronoi_regions_from_coords(np.array(coords.apply(lambda g: (g.x, g.y)).tolist()),
                                                                       china_total[0])

fig, ax = plt.subplots(figsize=(8, 8))

ax = china_total.plot(ax=ax, facecolor='none',
                      edgecolor='white', linewidth=0.5)

(
    gpd
    .GeoSeries(poly_shapes)
    .buffer(-10*1000)
    .plot(ax=ax,
          facecolor='white',
          linewidth=0.2)
)

ax.set_xticks([])
ax.set_yticks([])

ax.set_facecolor('#4a4db7')
fig.set_facecolor('#4a4db7')

ax.spines['left'].set_color('none')
ax.spines['top'].set_color('none')
ax.spines['right'].set_color('none')
ax.spines['bottom'].set_color('none')

fig.savefig('图8.png', dpi=500, bbox_inches='tight', pad_inches=0)
以上就是本文的全部内容,欢迎在评论区与我进行讨论~