Introduction
The producer sends data directly to the broker that is the leader for the partition without any intervening routing tier.
Optimization Approach
Batching is one of the big drivers of efficiency, and to enable batching the Kafka producer will attempt to accumulate data in memory and to send out larger batches in a single request. The batching can be configured to accumulate no more than a fixed number of messages and to wait no longer than some fixed latency bound (say 64k or 10 ms). This allows the accumulation of more bytes to send, and few larger I/O operations on the servers. This buffering is configurable and gives a mechanism to trade off a small amount of additional latency for better throughput.
In order to find the optimal batch size and latency, iterative test supported by producer statistics monitoring is needed.
Enable Monitoring
Start the producer with the JMX parameters enabled:
JMX_PORT=10102 bin/kafka-console-producer.sh --broker-list localhost:9092--topic testtopic
Producer Metrics
Use jconsole application via JMX at port number 10102.
Tip: run jconsole application remotely to avoid impact on broker machine.
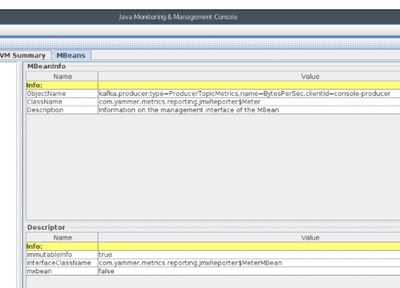
See metrics in MBeans tab.
The<strong>clientId</strong>parameter is the producer client ID for which you want the statistics.
<strong>kafka.producer:type=ProducerRequestMetrics,name=ProducerRequestRateAndTimeMs,clientId=console-producer</strong>
This MBean give values for the rate of producer requests taking place as well as latencies involved in that process. It gives latencies as a mean, the 50th, 75th, 95th, 98th, 99th, and 99.9thlatency percentiles. It also gives the time taken to produce the data as a mean, one minute average, five minute average, and fifteen minute average. It gives the count as well.
<strong>kafka.producer:type=ProducerRequestMetrics,name=ProducerRequestSize,clientId=console-producer</strong>
This MBean gives the request size for the producer. It gives the count, mean, max, min, standard deviation, and the 50th, 75th, 95th, 98th, 99th, and 99.9thpercentile of request sizes.
<strong>kafka.producer:type=ProducerStats,name=FailedSendsPerSec,clientId=console-producer</strong>
This gives the number of failed sends per second. It gives this value of counts, the mean rate, one minute average, five minute average, and fifteen minute average value for the failed requests per second.
<strong>kafka.producer:type=ProducerStats,name=SerializationErrorsPerSec,clientId=console-producer</strong>
This gives the number of serialization errors per second. It gives this value of counts, mean rate, one minute average, five minute average, and fifteen minute average value for the serialization errors per second.
<strong>kafka.producer:type=ProducerTopicMetrics,name=MessagesPerSec,clientId=console-producer</strong>
This gives the number of messages produced per second. It gives this value of counts, mean rate, one-minute average, five-minute average, and fifteen-minute average for the messages produced per second.
