6. 重采样及频率转换
重采样(resample)表示将时间序列的频率进行转换的过程。可以分为降采样和升采样等。
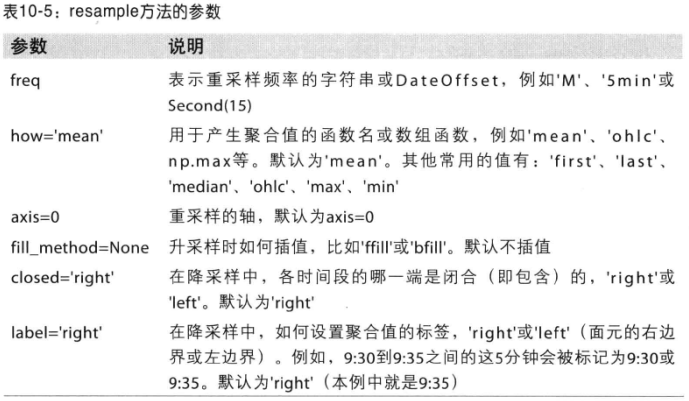
pandas对象都有一个resample方法,可以进行频率转换。
In [5]: rng = pd.date_range('1/1/2000', periods=100, freq='D')

In [6]: ts = Series(np.random.randn(len(rng)), index=rng)
# 聚合后的值如何处理,使用mean(),默认即为mean,也可以使用sum,min等。
In [8]: ts.resample('M').mean()
Out[8]:
2000-01-31   -0.128802
2000-02-29    0.179255
2000-03-31    0.055778
2000-04-30   -0.736071
Freq: M, dtype: float64

In [9]: ts.resample('M', kind='period').mean()
Out[9]:
2000-01   -0.128802
2000-02    0.179255
2000-03    0.055778
2000-04   -0.736071
Freq: M, dtype: float64

6.1 降采样
# 12个每分钟 的采样
In [10]: rng = pd.date_range('1/1/2017', periods=12, freq='T')

In [11]: ts = Series(np.arange(12), index=rng)

In [12]: ts
Out[12]:
2017-01-01 00:00:00     0
2017-01-01 00:01:00     1
2017-01-01 00:02:00     2
...
2017-01-01 00:08:00     8
2017-01-01 00:09:00     9
2017-01-01 00:10:00    10
2017-01-01 00:11:00    11
Freq: T, dtype: int32

# 每隔五分钟采用,并将五分钟内的值求和,赋值到新的Series中。
# 默认 [0,4),前闭后开
In [14]: ts.resample('5min').sum()
Out[14]:
2017-01-01 00:00:00    10
2017-01-01 00:05:00    35
2017-01-01 00:10:00    21
Freq: 5T, dtype: int32

# 默认 closed就是left,
In [15]: ts.resample('5min', closed='left').sum()
Out[15]:
2017-01-01 00:00:00    10
2017-01-01 00:05:00    35
2017-01-01 00:10:00    21
Freq: 5T, dtype: int32

# 调整到右闭左开后,但是时间取值还是left
In [16]: ts.resample('5min', closed='right').sum()
Out[16]:
2016-12-31 23:55:00     0
2017-01-01 00:00:00    15
2017-01-01 00:05:00    40
2017-01-01 00:10:00    11
Freq: 5T, dtype: int32

# 时间取值也为left,默认
In [17]: ts.resample('5min', closed='left', label='left').sum()
Out[17]:
2017-01-01 00:00:00    10
2017-01-01 00:05:00    35
2017-01-01 00:10:00    21
Freq: 5T, dtype: int32

还可以调整offset
# 向前调整1秒
In [18]: ts.resample('5T', loffset='1s').sum()
Out[18]:
2017-01-01 00:00:01    10
2017-01-01 00:05:01    35
2017-01-01 00:10:01    21
Freq: 5T, dtype: int32
OHLC重采样
金融领域有一种ohlc重采样方式,即开盘、收盘、最大值和最小值。
In [19]: ts.resample('5min').ohlc()
Out[19]:
                     open  high  low  close
2017-01-01 00:00:00     0     4    0      4
2017-01-01 00:05:00     5     9    5      9
2017-01-01 00:10:00    10    11   10     11
利用groupby进行重采样
In [20]: rng = pd.date_range('1/1/2017', periods=100, freq='D')

In [21]: ts = Series(np.arange(100), index=rng)

In [22]: ts.groupby(lambda x: x.month).mean()
Out[22]:
1    15.0
2    44.5
3    74.0
4    94.5
dtype: float64

In [23]: rng[0]
Out[23]: Timestamp('2017-01-01 00:00:00', offset='D')

In [24]: rng[0].month
Out[24]: 1

In [25]: ts.groupby(lambda x: x.weekday).mean()
Out[25]:
0    50.0
1    47.5
2    48.5
3    49.5
4    50.5
5    51.5
6    49.0
dtype: float64
6.2 升采样和插值
低频率到高频率的时候就会有缺失值,因此需要进行插值操作。
In [26]: frame = DataFrame(np.random.randn(2,4), index=pd.date_range('1/1/2017'
    ...: , periods=2, freq='W-WED'), columns=['Colorda','Texas','NewYork','Ohio
    ...: '])

In [27]: frame
Out[27]:
             Colorda     Texas   NewYork      Ohio
2017-01-04  1.666793 -0.478740 -0.544072  1.934226
2017-01-11 -0.407898  1.072648  1.079074 -2.922704

In [28]: df_daily = frame.resample('D')

In [30]: df_daily = frame.resample('D').mean()

In [31]: df_daily
Out[31]:
             Colorda     Texas   NewYork      Ohio
2017-01-04  1.666793 -0.478740 -0.544072  1.934226
2017-01-05       NaN       NaN       NaN       NaN
2017-01-06       NaN       NaN       NaN       NaN
2017-01-07       NaN       NaN       NaN       NaN
2017-01-08       NaN       NaN       NaN       NaN
2017-01-09       NaN       NaN       NaN       NaN
2017-01-10       NaN       NaN       NaN       NaN
2017-01-11 -0.407898  1.072648  1.079074 -2.922704


In [33]: frame.resample('D', fill_method='ffill')
C:UsersyangflAnaconda3Scriptsipython-script.py:1: FutureWarning: fill_metho
d is deprecated to .resample()
the new syntax is .resample(...).ffill()
  if __name__ == '__main__':
Out[33]:
             Colorda     Texas   NewYork      Ohio
2017-01-04  1.666793 -0.478740 -0.544072  1.934226
2017-01-05  1.666793 -0.478740 -0.544072  1.934226
2017-01-06  1.666793 -0.478740 -0.544072  1.934226
2017-01-07  1.666793 -0.478740 -0.544072  1.934226
2017-01-08  1.666793 -0.478740 -0.544072  1.934226
2017-01-09  1.666793 -0.478740 -0.544072  1.934226
2017-01-10  1.666793 -0.478740 -0.544072  1.934226
2017-01-11 -0.407898  1.072648  1.079074 -2.922704

In [34]: frame.resample('D', fill_method='ffill', limit=2)
C:UsersyangflAnaconda3Scriptsipython-script.py:1: FutureWarning: fill_metho
d is deprecated to .resample()
the new syntax is .resample(...).ffill(limit=2)
  if __name__ == '__main__':
Out[34]:
             Colorda     Texas   NewYork      Ohio
2017-01-04  1.666793 -0.478740 -0.544072  1.934226
2017-01-05  1.666793 -0.478740 -0.544072  1.934226
2017-01-06  1.666793 -0.478740 -0.544072  1.934226
2017-01-07       NaN       NaN       NaN       NaN
2017-01-08       NaN       NaN       NaN       NaN
2017-01-09       NaN       NaN       NaN       NaN
2017-01-10       NaN       NaN       NaN       NaN
2017-01-11 -0.407898  1.072648  1.079074 -2.922704

In [35]: frame.resample('W-THU', fill_method='ffill')
C:UsersyangflAnaconda3Scriptsipython-script.py:1: FutureWarning: fill_metho
d is deprecated to .resample()
the new syntax is .resample(...).ffill()
  if __name__ == '__main__':
Out[35]:
             Colorda     Texas   NewYork      Ohio
2017-01-05  1.666793 -0.478740 -0.544072  1.934226
2017-01-12 -0.407898  1.072648  1.079074 -2.922704

In [38]: frame.resample('W-THU').ffill()
Out[38]:
             Colorda     Texas   NewYork      Ohio
2017-01-05  1.666793 -0.478740 -0.544072  1.934226
2017-01-12 -0.407898  1.072648  1.079074 -2.922704
6.3 通过时期(period)进行重采样
# 创建一个每月随机数据,两年
In [41]: frame = DataFrame(np.random.randn(24,4), index=pd.date_range('1-2017',
    ...: '1-2019', freq='M'), columns=['Colorda','Texas','NewYork','Ohio'])

# 每年平均值进行重采样
In [42]: a_frame = frame.resample('A-DEC').mean()

In [43]: a_frame
Out[43]:
             Colorda     Texas   NewYork      Ohio
2017-12-31 -0.441948 -0.040711  0.036633 -0.328769
2018-12-31 -0.121778  0.181043 -0.004376  0.085500

# 按季度进行采用
In [45]: a_frame.resample('Q-DEC').ffill()
Out[45]:
             Colorda     Texas   NewYork      Ohio
2017-12-31 -0.441948 -0.040711  0.036633 -0.328769
2018-03-31 -0.441948 -0.040711  0.036633 -0.328769
2018-06-30 -0.441948 -0.040711  0.036633 -0.328769
2018-09-30 -0.441948 -0.040711  0.036633 -0.328769
2018-12-31 -0.121778  0.181043 -0.004376  0.085500

In [49]: frame.resample('Q-DEC').mean()
Out[49]:
             Colorda     Texas   NewYork      Ohio
2017-03-31 -0.445315  0.488191 -0.543567 -0.459284
2017-06-30 -0.157438 -0.680145  0.295301 -0.118013
2017-09-30 -0.151736  0.092512  0.684201 -0.035097
2017-12-31 -1.013302 -0.063404 -0.289404 -0.702681
2018-03-31  0.157538 -0.175134 -0.548305  0.609768
2018-06-30 -0.231697 -0.094108  0.224245 -0.151958
2018-09-30 -0.614219  0.308801 -0.205952  0.154302
2018-12-31  0.201266  0.684613  0.512506 -0.270111
7. 时间序列绘图
import numpy as np
import matplotlib.pyplot as plt
import pandas as pd
from pandas import Series,DataFrame

frame = DataFrame(np.random.randn(20,3),
                  index = pd.date_range('1/1/2017', periods=20, freq='M'),
                columns=['randn1','randn2','randn3']
                )
frame.plot()

8. 移动窗口函数
待续。。。
9. 性能和内存使用方面的注意事项
In [50]: rng = pd.date_range('1/1/2017', periods=10000000, freq='1s')

In [51]: ts = Series(np.random.randn(len(rng)), index=rng)

In [52]: %timeit ts.resample('15s').ohlc()
1 loop, best of 3: 222 ms per loop

In [53]: %timeit ts.resample('15min').ohlc()
10 loops, best of 3: 152 ms per loop

貌似现在还有所下降。