本示例演示如何用Web图表控件 ChartDirector 绘制一个配置有刷新率的实时图表。在本例中,由一个计时器驱动的随机数生成器生成新的数据值,新产生的值会转换到数据数组中,然后显示在图表上。图表由一个秒表进行更新,这样图表的刷新率可独立于数据率。此外,这个图表支持暂停以方便用户查看,但是后台的数据仍然在继续更新。
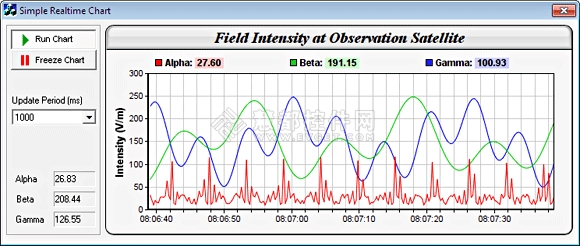
图表刷新计时器调用CChartViewer.updateViewPort以触发CVN_ViewPortChanged消息,然后图表就会更新它的处理程序。下面提供了ChartDirector绘制实时图表的示例代码(PS:这个图表只适用于Windows)。
代码
|
1
2
3
4
5
6
7
8
9
10
11
12
13
14
15
16
17
18
19
20
21
22
23
24
25
26
27
28
29
30
31
32
33
34
35
36
37
38
39
40
41
42
43
44
45
46
47
48
49
50
51
52
53
54
55
56
57
58
59
60
61
62
63
64
65
66
67
68
69
70
71
72
73
74
75
76
77
78
79
80
81
82
83
84
85
86
87
88
89
90
91
92
93
94
95
96
97
98
99
100
101
102
103
104
105
106
107
108
109
110
111
112
113
114
115
116
117
118
119
120
121
122
123
124
125
126
127
128
129
130
131
132
133
134
135
136
137
138
139
140
141
142
143
144
145
146
147
148
149
150
151
152
153
154
155
156
157
158
159
160
161
162
163
164
165
166
167
168
169
170
171
172
173
174
175
176
177
178
179
180
181
182
183
184
185
186
187
188
189
190
191
192
193
194
195
196
197
198
199
200
201
202
203
204
205
206
207
208
209
210
211
212
213
214
215
216
217
218
219
220
221
222
223
224
225
226
227
228
229
230
231
232
233
234
235
236
237
238
239
240
241
242
243
244
245
246
247
248
249
250
251
252
253
254
255
256
257
258
259
260
261
262
263
264
265
266
267
268
269
270
271
272
273
274
275
276
277
278
279
280
281
282
283
284
285
286
287
288
289
290
291
292
293
294
295
296
297
298
299
300
301
302
303
304
305
306
307
308
309
310
311
312
313
314
315
316
317
318
319
320
321
322
323
324
325
326
327
328
329
330
331
332
333
334
335
336
337
338
339
340
341
342
343
344
345
346
347
348
349
350
351
352
353
354
355
356
357
358
359
360
361
362
363
364
|
// realtimedemoDlg.cpp : implementation file//#include "stdafx.h"#include "realtimedemo.h"#include "realtimedemoDlg.h"#include <math.h>#ifdef _DEBUG#define new DEBUG_NEW#endif/////////////////////////////////////////////////////////////////////////////// CRealtimedemoDlg dialogstatic const int DataRateTimer = 1;static const int ChartUpdateTimer = 2;static const int DataInterval = 250;//// Constructor//CRealtimedemoDlg::CRealtimedemoDlg(CWnd* pParent /*=NULL*/) : CDialog(CRealtimedemoDlg::IDD, pParent){ m_hIcon = AfxGetApp()->LoadIcon(IDR_MAINFRAME);}void CRealtimedemoDlg::DoDataExchange(CDataExchange* pDX){ CDialog::DoDataExchange(pDX); //{{AFX_DATA_MAP(CRealtimedemoDlg) DDX_Control(pDX, IDC_GammaValue, m_ValueC); DDX_Control(pDX, IDC_BetaValue, m_ValueB); DDX_Control(pDX, IDC_AlphaValue, m_ValueA); DDX_Control(pDX, IDC_ChartViewer, m_ChartViewer); DDX_Control(pDX, IDC_RunPB, m_RunPB); DDX_Control(pDX, IDC_UpdatePeriod, m_UpdatePeriod); //}}AFX_DATA_MAP}BEGIN_MESSAGE_MAP(CRealtimedemoDlg, CDialog) //{{AFX_MSG_MAP(CRealtimedemoDlg) ON_WM_PAINT() ON_WM_QUERYDRAGICON() ON_WM_TIMER() ON_WM_DESTROY() ON_BN_CLICKED(IDC_RunPB, OnRunPB) ON_BN_CLICKED(IDC_FreezePB, OnFreezePB) ON_CBN_SELCHANGE(IDC_UpdatePeriod, OnSelchangeUpdatePeriod) ON_CONTROL(CVN_ViewPortChanged, IDC_ChartViewer, OnViewPortChanged) //}}AFX_MSG_MAPEND_MESSAGE_MAP()/////////////////////////////////////////////////////////////////////////////// CRealtimedemoDlg message handlers//// Initialization//BOOL CRealtimedemoDlg::OnInitDialog(){ CDialog::OnInitDialog(); // *** code automatically generated by VC++ MFC AppWizard *** // Set the icon for this dialog. The framework does this automatically // when the application's main window is not a dialog SetIcon(m_hIcon, TRUE); // Set big icon SetIcon(m_hIcon, FALSE); // Set small icon // // Initialize member variables // m_extBgColor = getDefaultBgColor(); // Default background color // Clear data arrays to Chart::NoValue for (int i = 0; i < sampleSize; ++i) m_timeStamps[i] = m_dataSeriesA[i] = m_dataSeriesB[i] = m_dataSeriesC[i] = Chart::NoValue; // Set m_nextDataTime to the current time. It is used by the real time random number // generator so it knows what timestamp should be used for the next data point. SYSTEMTIME st; GetLocalTime(&st); m_nextDataTime = Chart::chartTime(st.wYear, st.wMonth, st.wDay, st.wHour, st.wMinute, st.wSecond) + st.wMilliseconds / 1000.0; // // Initialize controls // // Set up the data acquisition mechanism. In this demo, we just use a timer to get a // sample every 250ms. SetTimer(DataRateTimer, DataInterval, 0); // The chart update rate (in ms) m_UpdatePeriod.SelectString(0, _T("1000")); // Load icons for the Run/Freeze buttons loadButtonIcon(IDC_RunPB, IDI_RunPB, 100, 20); loadButtonIcon(IDC_FreezePB, IDI_FreezePB, 100, 20); // Initially set the Run mode m_RunPB.SetCheck(1); OnRunPB(); return TRUE;}// *** code automatically generated by VC++ MFC AppWizard ***// If you add a minimize button to your dialog, you will need the code below// to draw the icon. For MFC applications using the document/view model,// this is automatically done for you by the framework.void CRealtimedemoDlg::OnPaint() { if (IsIconic()) { CPaintDC dc(this); // device context for painting SendMessage(WM_ICONERASEBKGND, (WPARAM) dc.GetSafeHdc(), 0); // Center icon in client rectangle int cxIcon = GetSystemMetrics(SM_CXICON); int cyIcon = GetSystemMetrics(SM_CYICON); CRect rect; GetClientRect(&rect); int x = (rect.Width() - cxIcon + 1) / 2; int y = (rect.Height() - cyIcon + 1) / 2; // Draw the icon dc.DrawIcon(x, y, m_hIcon); } else { CDialog::OnPaint(); }}// *** code automatically generated by VC++ MFC AppWizard ***// The system calls this to obtain the cursor to display while the user drags// the minimized window.HCURSOR CRealtimedemoDlg::OnQueryDragIcon(){ return (HCURSOR) m_hIcon;}//// User clicks on the Run pushbutton//void CRealtimedemoDlg::OnRunPB() { // Enable chart update timer CString s; m_UpdatePeriod.GetLBText(m_UpdatePeriod.GetCurSel(), s); SetTimer(ChartUpdateTimer, _tcstol(s, 0, 0), 0);}//// User clicks on the Freeze pushbutton//void CRealtimedemoDlg::OnFreezePB() { // Disable chart update timer KillTimer(ChartUpdateTimer); }//// Handles timer events//void CRealtimedemoDlg::OnTimer(UINT_PTR nIDEvent) { switch (nIDEvent) { case DataRateTimer: // Is data acquisition timer - get a new data sample getData(); break; case ChartUpdateTimer: // Is chart update timer - request chart update m_ChartViewer.updateViewPort(true, false); break; } CDialog::OnTimer(nIDEvent);}//// View port changed event//void CRealtimedemoDlg::OnViewPortChanged(){ drawChart(&m_ChartViewer);}//// User changes the chart update period//void CRealtimedemoDlg::OnSelchangeUpdatePeriod() { if (m_RunPB.GetCheck()) { // Call freeze then run to use the new chart update period OnFreezePB(); OnRunPB(); } }/////////////////////////////////////////////////////////////////////////////// CRealtimedemoDlg methods//// A utility to shift a new data value into a data array//static void shiftData(double *data, int len, double newValue){ memmove(data, data + 1, sizeof(*data) * (len - 1)); data[len - 1] = newValue;}//// The data acquisition routine. In this demo, this is invoked every 250ms.//void CRealtimedemoDlg::getData(){ // The current time in millisecond resolution SYSTEMTIME st; GetLocalTime(&st); double now = Chart::chartTime(st.wYear, st.wMonth, st.wDay, st.wHour, st.wMinute, st.wSecond) + st.wMilliseconds / 1000.0; // This is our formula for the random number generator do { // Get a data sample double p = m_nextDataTime * 4; double dataA = 20 + cos(p * 129241) * 10 + 1 / (cos(p) * cos(p) + 0.01); double dataB = 150 + 100 * sin(p / 27.7) * sin(p / 10.1); double dataC = 150 + 100 * cos(p / 6.7) * cos(p / 11.9); // Shift the values into the arrays shiftData(m_dataSeriesA, sampleSize, dataA); shiftData(m_dataSeriesB, sampleSize, dataB); shiftData(m_dataSeriesC, sampleSize, dataC); shiftData(m_timeStamps, sampleSize, m_nextDataTime); m_nextDataTime += DataInterval / 1000.0; } while (m_nextDataTime < now); // // We provide some visual feedback to the latest numbers generated, so you can see the // data being generated. // char buffer[1024]; sprintf(buffer, "%.2f", m_dataSeriesA[sampleSize - 1]); m_ValueA.SetWindowText(CString(buffer)); sprintf(buffer, "%.2f", m_dataSeriesB[sampleSize - 1]); m_ValueB.SetWindowText(CString(buffer)); sprintf(buffer, "%.2f", m_dataSeriesC[sampleSize - 1]); m_ValueC.SetWindowText(CString(buffer));}//// Draw the chart and display it in the given viewer//void CRealtimedemoDlg::drawChart(CChartViewer *viewer){ // Create an XYChart object 600 x 270 pixels in size, with light grey (f4f4f4) // background, black (000000) border, 1 pixel raised effect, and with a rounded frame. XYChart *c = new XYChart(600, 270, 0xf4f4f4, 0x000000, 1); c->setRoundedFrame(m_extBgColor); // Set the plotarea at (55, 62) and of size 520 x 175 pixels. Use white (ffffff) // background. Enable both horizontal and vertical grids by setting their colors to // grey (cccccc). Set clipping mode to clip the data lines to the plot area. c->setPlotArea(55, 62, 520, 175, 0xffffff, -1, -1, 0xcccccc, 0xcccccc); c->setClipping(); // Add a title to the chart using 15 pts Times New Roman Bold Italic font, with a light // grey (dddddd) background, black (000000) border, and a glass like raised effect. c->addTitle("Field Intensity at Observation Satellite", "timesbi.ttf", 15 )->setBackground(0xdddddd, 0x000000, Chart::glassEffect()); // Add a legend box at the top of the plot area with 9pts Arial Bold font. We set the // legend box to the same width as the plot area and use grid layout (as opposed to // flow or top/down layout). This distributes the 3 legend icons evenly on top of the // plot area. LegendBox *b = c->addLegend2(55, 33, 3, "arialbd.ttf", 9); b->setBackground(Chart::Transparent, Chart::Transparent); b->setWidth(520); // Configure the y-axis with a 10pts Arial Bold axis title c->yAxis()->setTitle("Intensity (V/m)", "arialbd.ttf", 10); // Configure the x-axis to auto-scale with at least 75 pixels between major tick and // 15 pixels between minor ticks. This shows more minor grid lines on the chart. c->xAxis()->setTickDensity(75, 15); // Set the axes width to 2 pixels c->xAxis()->setWidth(2); c->yAxis()->setWidth(2); // Now we add the data to the chart. double lastTime = m_timeStamps[sampleSize - 1]; if (lastTime != Chart::NoValue) { // Set up the x-axis to show the time range in the data buffer c->xAxis()->setDateScale(lastTime - DataInterval * sampleSize / 1000, lastTime); // Set the x-axis label format c->xAxis()->setLabelFormat("{value|hh:nn:ss}"); // Create a line layer to plot the lines LineLayer *layer = c->addLineLayer(); // The x-coordinates are the timeStamps. layer->setXData(DoubleArray(m_timeStamps, sampleSize)); // The 3 data series are used to draw 3 lines. Here we put the latest data values // as part of the data set name, so you can see them updated in the legend box. char buffer[1024]; sprintf(buffer, "Alpha: <*bgColor=FFCCCC*> %.2f ", m_dataSeriesA[sampleSize - 1]); layer->addDataSet(DoubleArray(m_dataSeriesA, sampleSize), 0xff0000, buffer); sprintf(buffer, "Beta: <*bgColor=CCFFCC*> %.2f ", m_dataSeriesB[sampleSize - 1]); layer->addDataSet(DoubleArray(m_dataSeriesB, sampleSize), 0x00cc00, buffer); sprintf(buffer, "Gamma: <*bgColor=CCCCFF*> %.2f ", m_dataSeriesC[sampleSize - 1]); layer->addDataSet(DoubleArray(m_dataSeriesC, sampleSize), 0x0000ff, buffer); } // Set the chart image to the WinChartViewer viewer->setChart(c); delete c;}/////////////////////////////////////////////////////////////////////////////// General utilities//// Get the default background color//int CRealtimedemoDlg::getDefaultBgColor(){ LOGBRUSH LogBrush; HBRUSH hBrush = (HBRUSH)SendMessage(WM_CTLCOLORDLG, (WPARAM)CClientDC(this).m_hDC, (LPARAM)m_hWnd); ::GetObject(hBrush, sizeof(LOGBRUSH), &LogBrush); int ret = LogBrush.lbColor; return ((ret & 0xff) << 16) | (ret & 0xff00) | ((ret & 0xff0000) >> 16);}//// Load an icon resource into a button//void CRealtimedemoDlg::loadButtonIcon(int buttonId, int iconId, int width, int height){ GetDlgItem(buttonId)->SendMessage(BM_SETIMAGE, IMAGE_ICON, (LPARAM)::LoadImage( AfxGetResourceHandle(), MAKEINTRESOURCE(iconId), IMAGE_ICON, width, height, LR_DEFAULTCOLOR)); } |
欲了解chartdirector更多详细信息和下载可以参阅ChartDirector中文介绍+下载