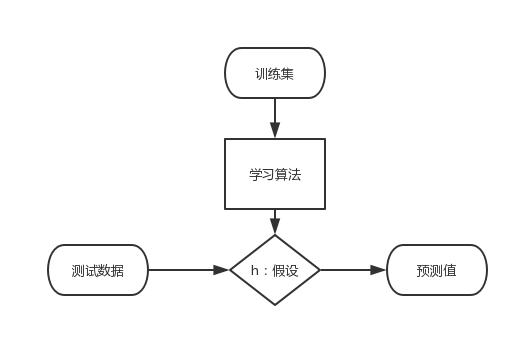
线性回归(Linear regesstion)
Notation
m:样本数量
n:特征数量 #feature
X:输入变量/特征
y:输出变量/目标变量
(x , y )、(x1,x2,y):训练样本
(xi,yi):第i组训练样本

假设

代价函数 Cost Function(最小二乘)
目标函数
[θ]min J(θ)
梯度下降(Gradient descent)
Batch GD

SGD (接近局部最优解)

正规方程组(Normal Equation)
向量/矩阵的导数
参考文档
迹的定理


正规方程推导过程

结果
关于伪逆

Feature Scaling
- Mean Normalization

补充:矩阵的求导与迹
http://www.cnblogs.com/crackpotisback/p/5545708.html
代码实践--房价预测
# -*- coding: utf-8 -*-
"""
Created on Wed Mar 15 16:02:07 2017
@author: LoveDMR
"""
import numpy as np
import matplotlib.pyplot as plt
from mpl_toolkits.mplot3d import Axes3D
from sklearn.linear_model import LinearRegression
def Feature_Scaling( data ):
    return ( data - np.mean(data) )/( np.max(data)-np.min(data) )

def Linear_Regression( X , y , times=400 , alpha=0.1 ):
    X = np.c_[np.ones( len(X) ) , X ].astype(np.float64)
    theta = np.zeros( X.shape[1] )
    for i in range(times):
        h = np.dot(X , theta.T) - y.T
        diff = np.dot(  h.T , X )
        theta -= diff.T * alpha
#        print theta
    return theta.T
def Cost_Funcation( theta , X , y ):
    X = np.c_[np.ones( len(X) ) , X ].astype(np.float64)
    return np.sum ((np.dot(X , theta.T) - y.T) ** 2) * 0.5 * len(y)

if __name__ == '__main__':
    path = r'C:UsersLoveDMRDesktopex1data2.txt'
    df = np.loadtxt( path , dtype=np.float64,delimiter=',')
    X , y = df[:,:-1] , df[:,-1]

    '''
    使用sklearn
    '''
    for i in range( X.shape[1] ):
        X[:,i] = Feature_Scaling(X[:,i])
    y = Feature_Scaling(y)

    model = LinearRegression()
    model.fit(X, y.T)
    print "Sklearn --  截距: " , model.intercept_ , "系数:" ,  model.coef_
    '''
    手工编写
    '''
    theta = Linear_Regression(X ,y.T , 2000 , 0.01 )
    cost = Cost_Funcation( theta , X , y )
    print "Handmade --  截距: " , theta[0], "系数:" , theta[1:]

    fig = plt.figure()
    ax = Axes3D(fig)
    X_axis = np.arange(-1, 1, 0.05)
    Y_axis = np.arange(-1, 1, 0.05)
    X_axis, Y_axis = np.meshgrid(X_axis, Y_axis)
    Z = X_axis * theta[1] +  Y_axis * theta[2] + theta[0]
    R = X_axis * model.coef_[0] +  Y_axis * model.coef_[1] + model.intercept_
    ax.plot_surface(X_axis, Y_axis, Z, rstride=1, cstride=1, cmap='rainbow')
    ax.plot_surface(X_axis, Y_axis, R, rstride=1, cstride=1, color='g')
    ax.scatter(X[:,0] , X[:,1],y,c='r')
    plt.grid()
    plt.show()
Sklearn -- 截距: -2.01817832286e-17 系数: [ 0.95241114 -0.06594731]
Handmade -- 截距: -2.59514632006e-17 系数: [ 0.95241112 -0.06594728]