转载请标明出处:
首发于:https://www.fangzhipeng.com/springcloud/2017/07/12/sc12-hystix-dashbd/
本文出自方志朋的博客
最新Finchley版本,请访问:
https://www.fangzhipeng.com/springcloud/2018/08/30/sc-f12-dash/
或者
http://blog.csdn.net/forezp/article/details/81041113
在我的第四篇文章断路器讲述了如何使用断路器,并简单的介绍了下Hystrix Dashboard组件,这篇文章更加详细的介绍Hystrix Dashboard。
一、Hystrix Dashboard简介
在微服务架构中为例保证程序的可用性,防止程序出错导致网络阻塞,出现了断路器模型。断路器的状况反应了一个程序的可用性和健壮性,它是一个重要指标。Hystrix Dashboard是作为断路器状态的一个组件,提供了数据监控和友好的图形化界面。
二、准备工作
本文的的工程栗子,来源于第一篇文章的栗子,在它的基础上进行改造。
三、开始改造service-hi
在pom的工程文件引入相应的依赖:
<dependency>
			<groupId>org.springframework.boot</groupId>
			<artifactId>spring-boot-starter-actuator</artifactId>
		</dependency>

		<dependency>
			<groupId>org.springframework.cloud</groupId>
			<artifactId>spring-cloud-starter-hystrix-dashboard</artifactId>
		</dependency>
		<dependency>
			<groupId>org.springframework.cloud</groupId>
			<artifactId>spring-cloud-starter-hystrix</artifactId>
		</dependency>
其中,这三个依赖是必须的,缺一不可。
在程序的入口ServiceHiApplication类,加上@EnableHystrix注解开启断路器,这个是必须的,并且需要在程序中声明断路点HystrixCommand;加上@EnableHystrixDashboard注解,开启HystrixDashboard
@SpringBootApplication
@EnableEurekaClient
@RestController
@EnableHystrix
@EnableHystrixDashboard
public class ServiceHiApplication {

	public static void main(String[] args) {
		SpringApplication.run(ServiceHiApplication.class, args);
	}

	@Value("${server.port}")
	String port;
	@RequestMapping("/hi")
	@HystrixCommand(fallbackMethod = "hiError")
	public String home(@RequestParam String name) {
		return "hi "+name+",i am from port:" +port;
	}

	public String hiError(String name) {
		return "hi,"+name+",sorry,error!";
	}
}
运行程序: 依次开启eureka-server 和service-hi.
四、Hystrix Dashboard图形展示
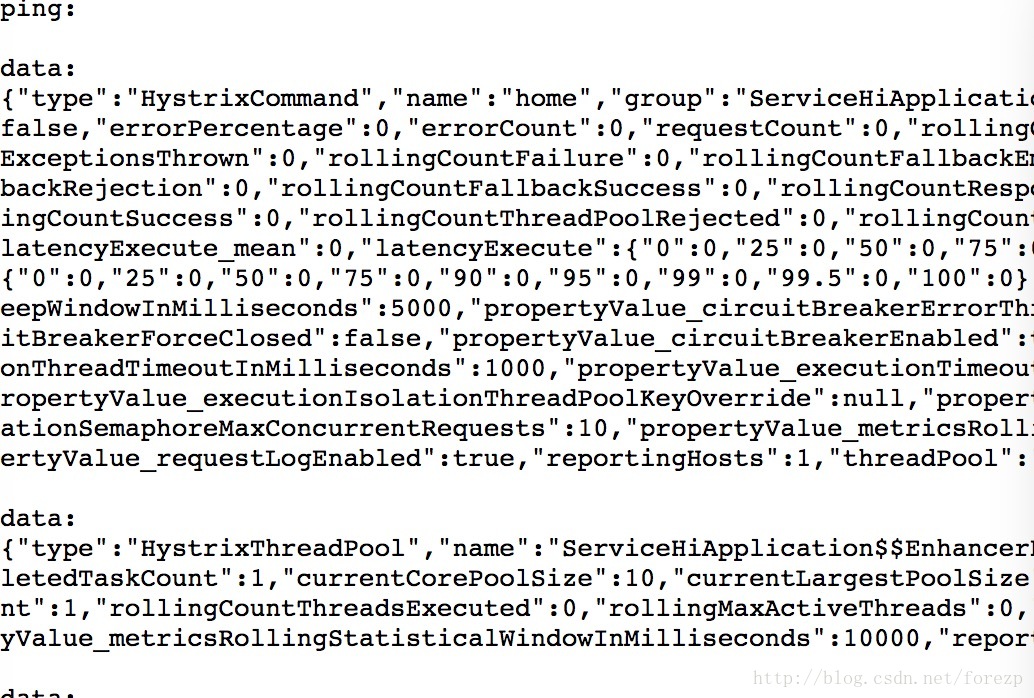
打开http://localhost:8762/hystrix.stream,可以看到一些具体的数据:
打开locahost:8762/hystrix 可以看见以下界面:
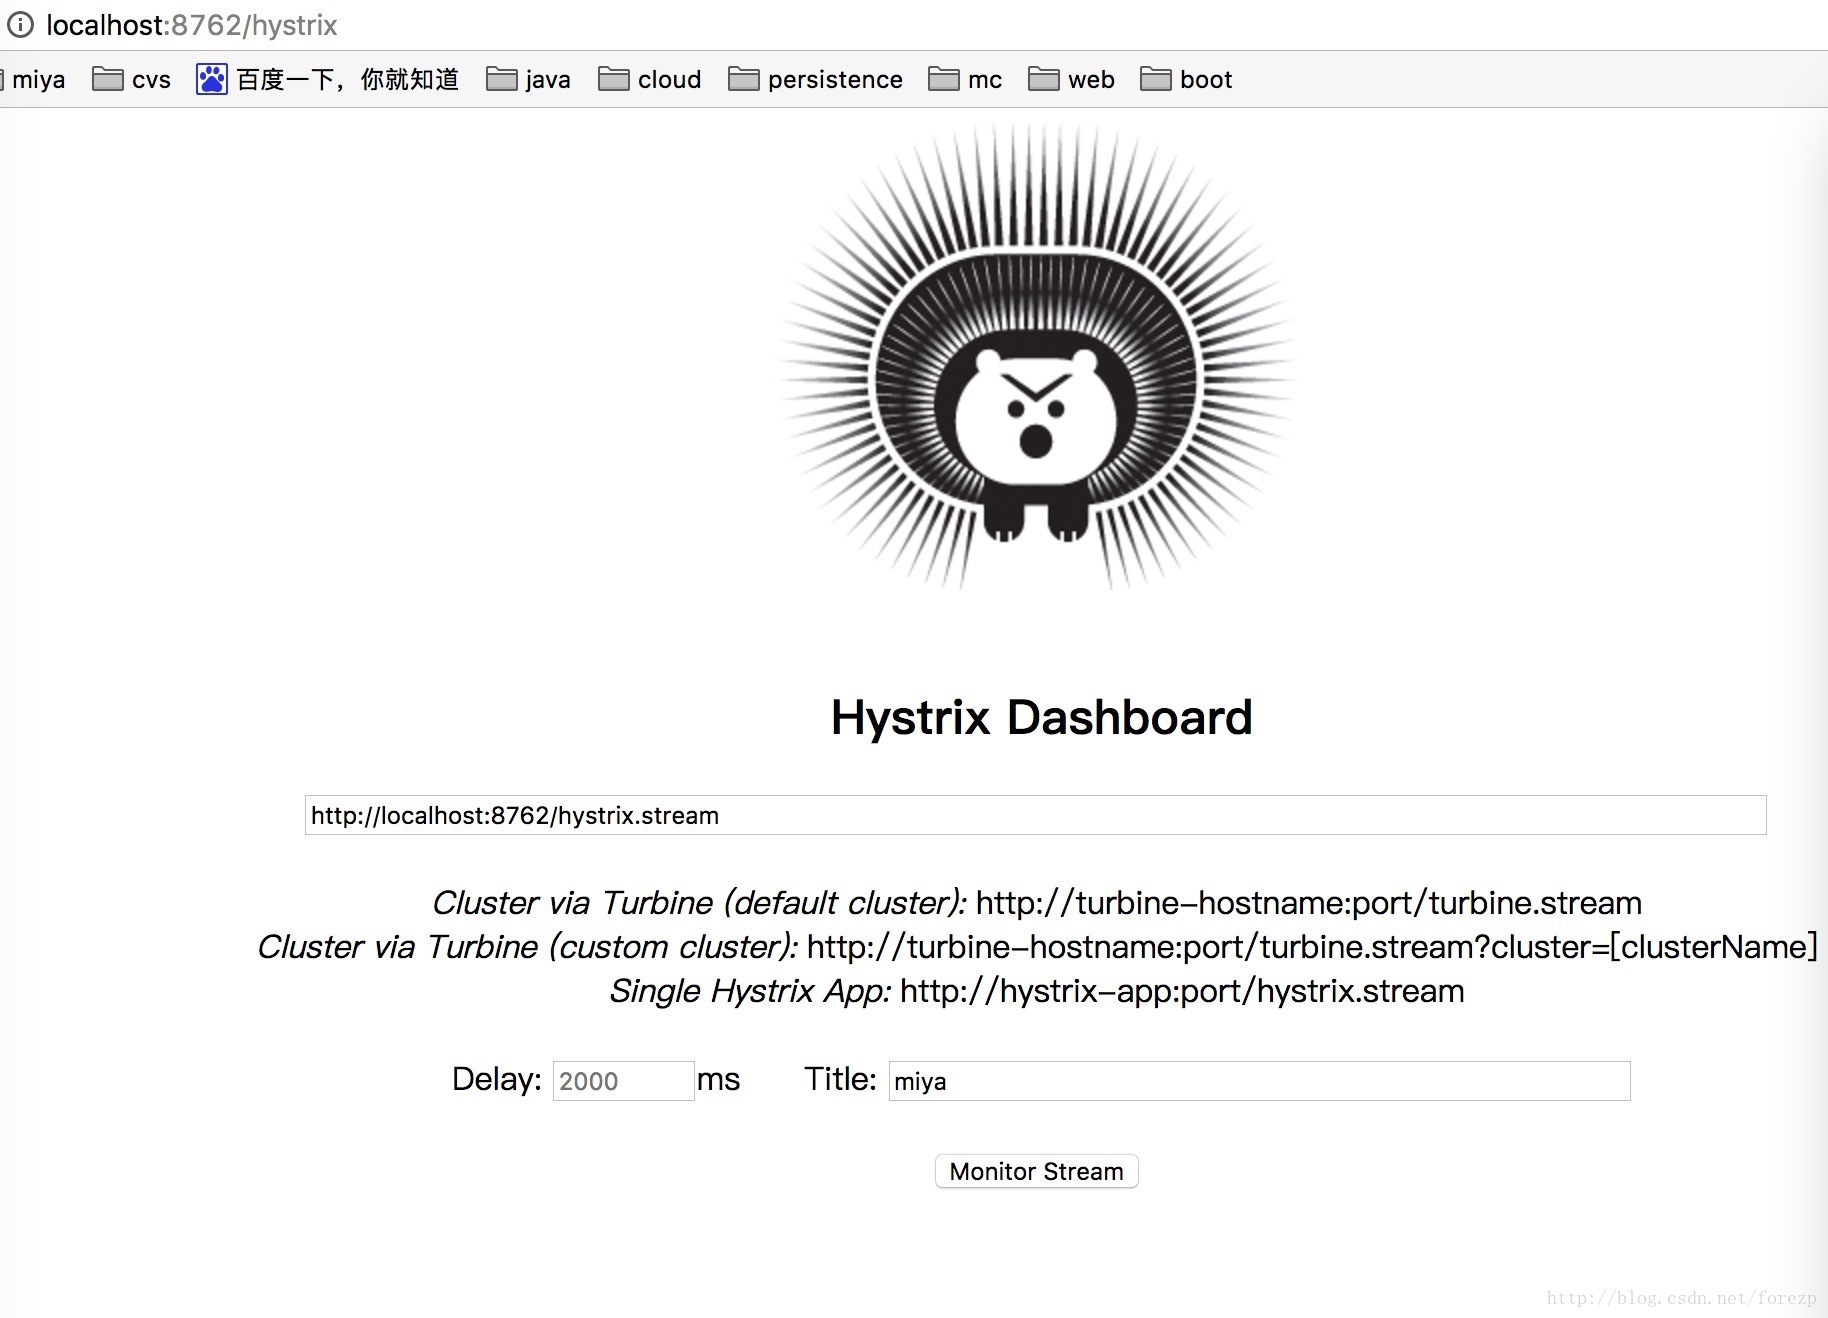
在界面依次输入:locahost:8762/hystrix.stream 、2000 、miya
;点确定。
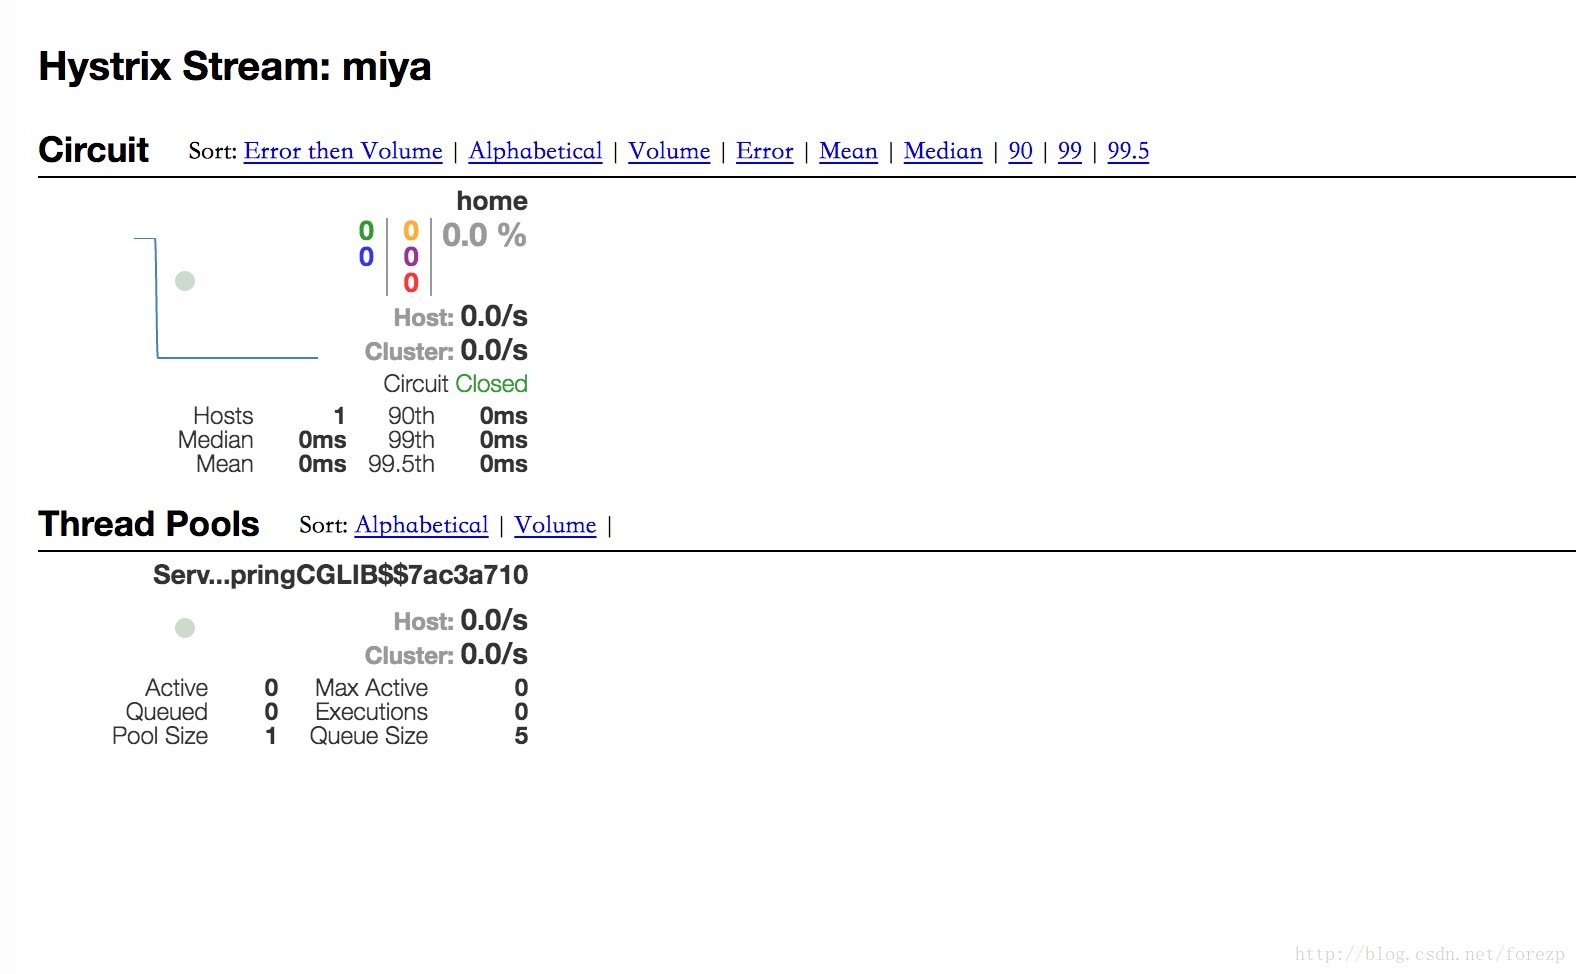
在另一个窗口输入: http://localhost:8762/hi?name=forezp
重新刷新hystrix.stream网页,你会看到良好的图形化界面:
源码下载:
https://github.com/forezp/SpringCloudLearning/tree/master/chapter12
五、参考资料

扫码关注公众号有惊喜
(转载本站文章请注明作者和出处 方志朋的博客)