画折线图流程
- 画一个表格
- 画一个坐标系
- 描点连线
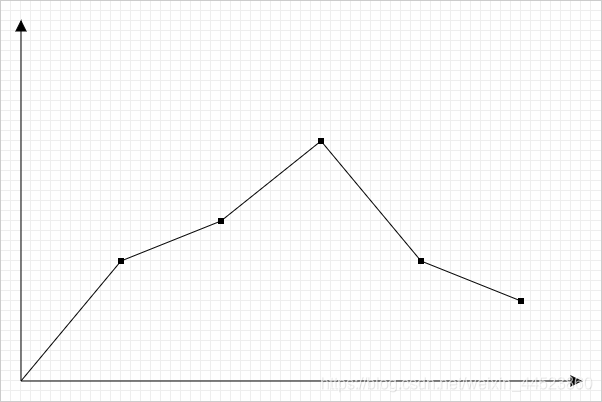
效果图
代码完整详解
1. 简单样式style
			canvas{
				border:1px solid #ccc
			}
2. 在body里创建画布
<canvas width="600" height="400"></canvas>
3. 在js写方法
var LineChart = function (ctx) {
this.ctx = ctx || document.querySelector('canvas').getContext('2d');
this.canvasWidth = this.ctx.canvas.width;
this.canvasHeight = this.ctx.canvas.height;
this.gridSize = 10;
this.space = 20;
this.x0 = this.space;
this.y0 = this.canvasHeight-this.space
this.arrowSize = 10;
this.dottedSize = 6
}
LineChart.prototype.init = function (data) {
this.drawGrid();
this.drawAxis();
this.drawDotted(data);
}
LineChart.prototype.drawGrid = function () {
var xLineTotal = Math.floor(this.canvasHeight/this.gridSize)
this.ctx.strokeStyle = '#eee';
for(var i = 0 ; i <xLineTotal ; i++){
this.ctx.beginPath();
this.ctx.moveTo(0 , i * this.gridSize - 0.5);
this.ctx.lineTo(this.canvasWidth , i * this.gridSize - 0.5)
this.ctx.stroke()
}
var yLineTotal = Math.floor(this.canvasWidth/this.gridSize);
for( var i = 0 ; i < yLineTotal ; i ++ ){
this.ctx.beginPath();
this.ctx.moveTo(i * this.gridSize - 0.5 , 0)
this.ctx.lineTo(i * this.gridSize- 0.5 ,this.canvasHeight)
this.ctx.stroke()
}
}
LineChart.prototype.drawAxis = function () {
this.ctx.beginPath();
this.ctx.strokeStyle = '#000';
this.ctx.moveTo(this.x0,this.y0)
this.ctx.lineTo(this.canvasWidth - this.space , this.y0)
this.ctx.lineTo(this.canvasWidth - this.space - this.arrowSize , this.y0 - this.arrowSize/2);
this.ctx.lineTo(this.canvasWidth - this.space - this.arrowSize , this.y0 + this.arrowSize/2);
this.ctx.lineTo(this.canvasWidth -this.space , this.y0)
this.ctx.stroke();
this.ctx.fill();
this.ctx.beginPath()
this.ctx.strokeStyle = '#000'
this.ctx.moveTo(this.x0,this.y0)
this.ctx.lineTo(this.x0 , this.space)
this.ctx.lineTo(this.x0 - this.arrowSize / 2 , this.space + this.arrowSize)
this.ctx.lineTo(this.x0 + this.arrowSize / 2 , this.space + this.arrowSize)
this.ctx.lineTo(this.x0 , this.space)
this.ctx.stroke();
this.ctx.fill()
}
LineChart.prototype.drawDotted = function (data) {
var that = this;
var prevCanvasX = 0 ;
var prevCanvasy = 0 ;
data.forEach(function (item,i){
var canvasX = that.x0 + item.x;
var canvasY = that.y0 - item.y;
that.ctx.beginPath();
that.ctx.moveTo(canvasX - that.dottedSize / 2 ,canvasY - that.dottedSize / 2);
that.ctx.lineTo(canvasX - that.dottedSize / 2 , canvasY + that.dottedSize / 2);
that.ctx.lineTo(canvasX + that.dottedSize / 2 ,canvasY + that.dottedSize / 2 );
that.ctx.lineTo(canvasX + that.dottedSize / 2 , canvasY - that.dottedSize / 2 );
that.ctx.closePath();
that.ctx.fill();
if(i == 0) {
that.ctx.beginPath()
that.ctx.moveTo(that.x0 , that.y0)
that.ctx.lineTo(canvasX,canvasY)
that.ctx.stroke()
}else{
that.ctx.beginPath()
that.ctx.moveTo(prevCanvasX,prevCanvasY)
that.ctx.lineTo(canvasX,canvasY)
that.ctx.stroke()
}
prevCanvasX = canvasX
prevCanvasY = canvasY
})
}
var data = [
{
x: 100,
y: 120
},
{
x: 200,
y: 160
},
{
x: 300,
y: 240
},
{
x: 400,
y: 120
},
{
x: 500,
y: 80
}
];
var LineChart = new LineChart();
LineChart.init(data)