Refer to R Tutorial andExercise Solution
Mean, 平均值
The mean of an observation variable is a numerical measure of the central location of the data values. It is the sum of its data values divided by data count.
Hence, for a data sample of size n, its sample mean is defined as follows:

> duration = faithful$eruptions # the eruption durations
> mean(duration) # apply the mean function
[1] 3.4878
Median, 中位数
The median of an observation variable is the value at the middle when the data is sorted in ascending order. It is an ordinal measure of the central location of the data values.
> duration = faithful$eruptions # the eruption durations
> median(duration) # apply the median function
[1] 4
Quartile, 四分位数, 中位数即第二四分位数
There are several quartiles of an observation variable.
The first quartile, or lower quartile, is the value that cuts off the first 25% of the data when it is sorted in ascending order.
The second quartile, or median, is the value that cuts off the first 50%.
The third quartile, or upper quartile, is the value that cuts off the first 75%.
> duration = faithful$eruptions # the eruption durations
> quantile(duration) # apply the quantile function
0% 25% 50% 75% 100%
1.6000 2.1627 4.0000 4.4543 5.1000
Percentile, 百分位数
The nth percentile of an observation variable is the value that cuts off the first n percent of the data values when it is sorted in ascending order.
Find the 32nd, 57th and 98th percentiles
> duration = faithful$eruptions # the eruption durations
> quantile(duration, c(.32, .57, .98))
32% 57% 98%
2.3952 4.1330 4.9330
Range
The range of an observation variable is the difference of its largest and smallest data values. It is a measure of how far apart the entire data spreads in value.

> duration = faithful$eruptions # the eruption durations
> max(duration) − min(duration) # apply the max and min functions
[1] 3.5
Interquartile Range, 四分位距
The interquartile range of an observation variable is the difference of its upper and lower quartiles. It is a measure of how far apart the middle portion of data spreads in value.

> duration = faithful$eruptions # the eruption durations
> IQR(duration) # apply the IQR function
[1] 2.2915
Box Plot, 箱线图
The box plot of an observation variable is a graphical representation based on its quartiles, as well as its smallest and largest values. It attempts to provide a visual shape of the data distribution.
> duration = faithful$eruptions # the eruption durations
> boxplot(duration, horizontal=TRUE) # horizontal box plot
The box plot of the eruption duration is:
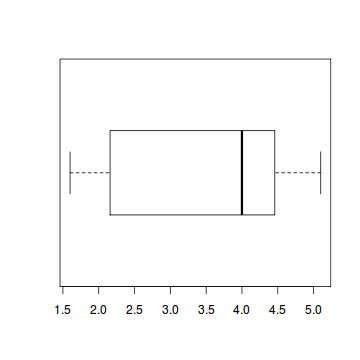
这个图就是用图形化来表示四分位数, box的三条边表示第一, 二, 三四分位数, 那条最粗的就是第二四分位数, 即中位数
0% 25% 50% 75% 100%
1.6000 2.1627 4.0000 4.4543 5.1000
从这个图可以看出数据的分布...
Variance, 方差
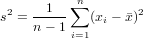
The variance is a numerical measure of how the data values is dispersed around the mean. In particular, the sample variance is defined as:
> duration = faithful$eruptions # the eruption durations
> var(duration) # apply the var function
[1] 1.3027
Standard Deviation, 标准偏差
The standard deviation of an observation variable is the square root of its variance.
> duration = faithful$eruptions # the eruption durations
> sd(duration) # apply the sd function
[1] 1.1414
Covariance, 协方差
The covariance of two variables x and y in a data sample measures how the two are linearly related. A positive covariance would indicates a positive linear relationship between the variables, and a negative covariance would indicate the opposite.
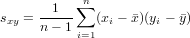
The sample covariance is defined in terms of the sample means as:
> duration = faithful$eruptions # the eruption durations
> waiting = faithful$waiting # the waiting period
> cov(duration, waiting) # apply the cov function
[1] 13.978
Correlation Coefficient, 相关系数
The correlation coefficient of two variables in a data sample is their covariance divided by the product of their individual standard deviations. It is a normalized measurement of how the two are linearly related.
Formally, the sample correlation coefficient is defined by the following formula, where sx and sy are the sample standard deviations, and sxy is the sample covariance.

If the correlation coefficient is close to 1, it would indicates that the variables are positively linearly related and the scatter plot falls almost along a straight line with positive slope.
For -1, it indicates that the variables are negatively linearly related and the scatter plot almost falls along a straight line with negative slope.
And for zero, it would indicates a weak linear relationship between the variables.
> duration = faithful$eruptions # the eruption durations
> waiting = faithful$waiting # the waiting period
> cor(duration, waiting) # apply the cor function
[1] 0.90081
说明喷发时间和等待时间成正比, 等的越久就喷的越久...
协方差和相关系数
1、协方差是一个用于测量投资组合中某一具体投资项目相对于另一投资项目风险的统计指标,通俗点就是投资组合中两个项目间收益率的相关程度,正数说明两个项目一个收益率上升,另一个也上升,收益率呈同方向变化。如果是负数,则一个上升另一个下降,表明收益率是反方向变化。协方差的绝对值越大,表示这两种资产收益率关系越密切;绝对值越小表明这两种资产收益率的关系越疏远。
2、由于协方差比较难理解,所以将协方差除以两个投资方案投资收益率的标准差之积,得出一个与协方差具有相同性质却没有量化的数。这个数就是相关系数。计算公式为相关系数=协方差/两个项目标准差之积。
Central Moment, 中心矩
The kth central moment (or moment about the mean) of a data sample is:
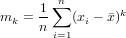
For example, the second central moment of a population is its variance.
> library(moments) # load the moments package
> duration = faithful$eruptions # the eruption durations
> moment(duration, order=3, central=TRUE)
[1] −0.6149
Skewness, 偏斜度
The skewness of a data population is defined by the following formula, where μ2 and μ3 are the second and third central moments.

Intuitively, the skewness is a measure of symmetry.
Negative skewness indicates that the mean of the data values is less than the median, and the data distribution is left-skewed;
Positive skewness would indicates that the mean of the data values is larger than the median, and the data distribution is right-skewed. Of course, this rule applies only to unimodal distributions whose histograms have a single peak.
> library(moments) # load the moments package
> duration = faithful$eruptions # the eruption durations
> skewness(duration) # apply the skewness function
[1] -0.41584
Kurtosis, 峰态
The kurtosis of a univariate population is defined by the following formula, where μ2 and μ4 are the second and fourth central moments.

Intuitively, the kurtosis is a measure of the peakedness of the data distribution.
Negative kurtosis would indicates a flat distribution, which is said to be platykurtic(平顶).
Positive kurtosis would indicates a peaked distribution, which is said to be leptokurtic(尖顶).
Finally, the normal distribution has zero kurtosis, and is said to be mesokurtic(常态峰的).
> library(moments) # load the moments package
> duration = faithful$eruptions # the eruption durations
> kurtosis(duration) - 3 # apply the kurtosis function
[1] -1.5006