Refer to R Tutorial andExercise Solution
A probability distribution describes how the values of a random variable is distributed.
Binomial Distribution, 二项分布
The binomial distribution is a discrete probability distribution. It describes the outcome of n independent trials in an experiment. Each trial is assumed to have only two outcome, labeled as success or failure. If the probability of a successful trial is p, then the probability of having x successful trials in an experiment is as follows.
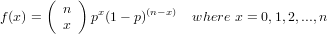
描述随机现象的一种常用概率分布形式,因与二项式展开式相同而得名。即重复n次的伯努利试验。在每次试验中只有两种可能的结果,而且是互相对立的,是独立的,与其它各次试验结果无关,结果事件发生的概率在整个系列试验中保持不变,则这一系列试验称为伯努力试验。
一个简单的例子如下:掷一枚骰子十次,那么掷得4的次数就服从n = 10、p = 1/6的二项分布。
we apply the function pbinom with x = 4, n = 12, p = 0.2.
> pbinom(4, size=12, prob=0.2)
[1] 0.92744
Poisson Distribution, 泊松分布
The Poisson distribution is the probability distribution of independent events occurrence in an interval. If λ is the mean occurrence per interval, then the probability of having x occurrence within a given interval is:
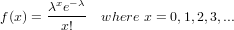
泊松分布适合于描述单位时间内随机事件发生的次数。如某一服务设施在一定时间内到达的人数,电话交换机接到呼叫的次数,汽车站台的候客人数,机器出现的故障数,自然灾害发生的次数等等。
If there are twelve cars crossing a bridge per minute on average, find the probability of having sixteen or more cars crossing the bridge in a particular minute.
We compute the upper tail probability of the Poisson distribution with the function ppois.
> ppois(16, lambda=12, lower=FALSE) # find upper tail
[1] 0.10129If there are twelve cars crossing a bridge per minute on average, the probability of having sixteen or more cars crossing the bridge in a particular minute is 10.1%.
泊松分布与二项分布的区别
当二项分布的n很大而p很小时,泊松分布可作为二项分布的近似,其中λ为np。通常当n≧10,p≦0.1时,就可以用泊松公式近似计算。
Continuous Uniform Distribution, 连续均匀分布
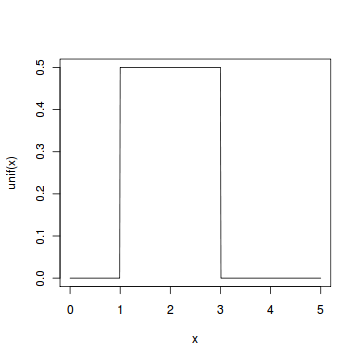
The continuous uniform distribution is the probability distribution of random number selection from the continuous interval between a and b. Its density function is defined by the following.
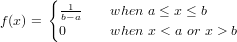
Here is a graph of the continuous uniform distribution with a = 1, b = 3.
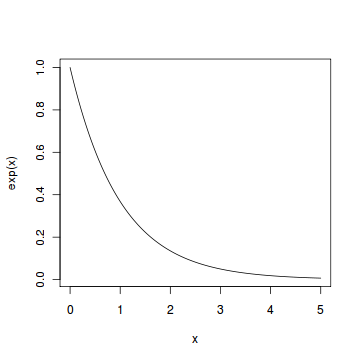
Exponential Distribution, 指数分布
The exponential distribution describes the arrival time of a randomly recurring independent event sequence. If μ is the mean waiting time for the next event recurrence, its probability density function is:
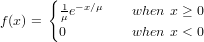
Here is a graph of the exponential distribution with μ = 1.
指数分布(Exponential distribution)是一种连续概率分布。指数分布可以用来表示独立随机事件发生的时间间隔,比如旅客进机场的时间间隔、中文维基百科新条目出现的时间间隔等等。
Suppose the mean checkout time of a supermarket cashier is three minutes. Find the probability of a customer checkout being completed by the cashier in less than two minutes.
The checkout processing rate is equals to one divided by the mean checkout completion time. Hence the processing rate is 1/3 checkouts per minute. We then apply the function pexp of the exponential distribution with rate=1/3.
> pexp(2, rate=1/3)
[1] 0.48658
Normal Distribution, 正态分布
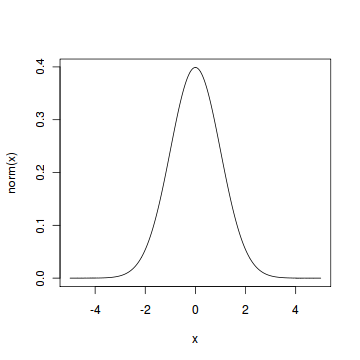
The normal distribution is defined by the following probability density function, where μ is the population mean and σ2 is the variance.
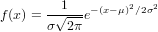
In particular, the normal distribution with μ = 0 and σ = 1 is called the standard normal distribution, and is denoted as N(0,1). It can be graphed as follows.
正态分布(Normal distribution)又名高斯分布(Gaussian distribution), 很重要的一种分布...因为中心极限定理
中心极限定理(Central Limit Theorem)
正态分布有一个非常重要的性质:在特定条件下,大量统计独立的随机变量的平均值的分布趋于正态分布,这就是中心极限定理。中心极限定理的重要意义在于,根据这一定理的结论,其他概率分布可以用正态分布作为近似。
- 参数为n和p的二项分布,在n相当大而且p不接近1或者0时近似于正态分布(有的参考书建议仅在np与n(1 − p)至少为5时才能使用这一近似). 近似正态分布平均数为μ = np且方差为σ2 = np(1 − p).
- 泊松分布带有参数λ当取样样本数很大时将近似正态分布λ. 近似正态分布平均数为μ = λ且方差为σ2 = λ.
Assume that the test scores of a college entrance exam fits a normal distribution. Furthermore, the mean test score is 72, and the standard deviation is 15.2. What is the percentage of students scoring 84 or more in the exam?
We apply the function pnorm of the normal distribution with mean 72 and standard deviation 15.2. Since we are looking for the percentage of students scoring higher than 84, we are interested in the upper tail of the normal distribution.
> pnorm(84, mean=72, sd=15.2, lower.tail=FALSE)
[1] 0.21492
Chi-squared Distribution, 卡方分布
If X1,X2,…,Xm are m independent random variables having the standard normal distribution, then the following quantity follows a Chi-Squared distribution with m degrees of freedom. Its mean is m, and its variance is 2m.

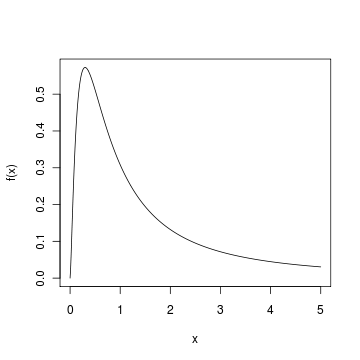
Here is a graph of the Chi-Squared distribution 7 degrees of freedom.
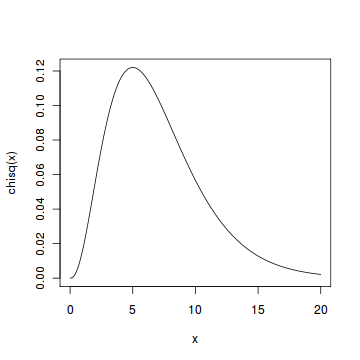
卡方分布(χ2分布)是概率论与统计学中常用的一种概率分布。k个独立的标准正态分布变量的平方和服从自由度为k的卡方分布。卡方分布常用于假设检验和置信区间的计算。
Find the 95th percentile of the Chi-Squared distribution with 7 degrees of freedom.
We apply the quantile function qchisq of the Chi-Squared distribution against the decimal values 0.95.
> qchisq(.95, df=7) # 7 degrees of freedom
[1] 14.067
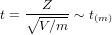
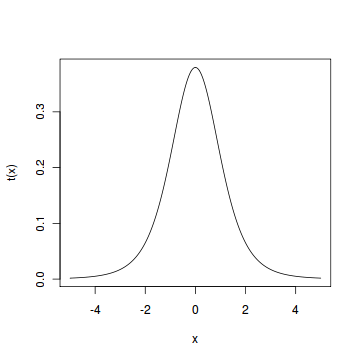
Student t Distribution, 学生t分布
Assume that a random variable Z has the standard normal distribution, and another random variable V has the Chi-Squared distribution with m degrees of freedom. Assume further that Z and V are independent, then the following quantity follows a Student t distribution with m degrees of freedom.
Here is a graph of the Student t distribution with 5 degrees of freedom.
Find the 2.5th and 97.5th percentiles of the Student t distribution with 5 degrees of freedom.
> qt(c(.025, .975), df=5) # 5 degrees of freedom
[1] -2.5706 2.5706
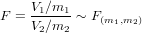
F Distribution, 费雪分布
If V 1 and V 2 are two independent random variables having the Chi-Squared distribution with m1 and m2 degrees of freedom respectively, then the following quantity follows an F distribution with m1 numerator degrees of freedom and m2 denominator degrees of freedom, i.e., (m1,m2) degrees of freedom.
Here is a graph of the F distribution with (5, 2) degrees of freedom.
Find the 95th percentile of the F distribution with (5, 2) degrees of freedom.
> qf(.95, df1=5, df2=2)
[1] 19.296
卡方分布(χ2分布)、t分布和F分布合称三大抽样分布, 因为他们都是基于正态分布的