https://cwiki.apache.org/confluence/display/FLINK/Flink+Internals
Memory Management (Batch API)
Introduction
Memory management in Flink serves the purpose to control how much memory certain runtime operations use.
The memory management is used for all operations that accumulate a (potentially large) number or records.
Typical examples of such operations are
- Sorting - Sorting is used to order records for grouping, joining, or to produce sorted results.
- Hash Tables - Hash tables are used in Joins and for the Solution set in iterations (pending work to use them for grouping/aggregations)
- Caching - Caching data is important for iterative algorithms, and for checkpoints during job recovery.
- (Block-)Nested-Loop-Join - This algorithm is used for Cartesian products between data sets.
Without a means to manage/control the memory, these operations would fail when the data to be sorted (or hashed) was larger than the
memory that the JVM could spare (usually with an OutOfMemoryException). The memory management is a way to control very
precisely how much memory each operator uses, and to let them de-stage efficiently to out-of-core operation, by moving some of the
data do disk. How exactly that happens is dependent on the specific operation/algorithm (see below).
The memory management allows also to divide memory between the different memory-consuming operators in the same JVM.
That way, Flink can make sure that different operators run next to each other in the same JVM, and do not interfere with each other,
but stay within their memory budget.
Note: As of this point, the memory management is used only in the batch operators. The streaming operators follow a different concept.
内存管理,是为了精确的控制特定的runtime operation使用多少内存,比如对于sorting,hashtable,caching这样可能耗费大量内存的operator;
内存管理只是用于batch,对于stream operator会遵循不同的策略。
Flink's Managed Memory
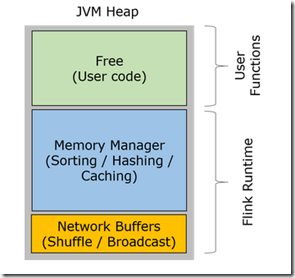
Conceptually, Flink splits the heap into three regions:
- Network buffers: A number of 32 KiByte buffers used by the network stack to buffer records for network transfer. Allocated on TaskManager startup. By default 2048 buffers are used, but can be adjusted via
"taskmanager.network.numberOfBuffers". - Memory Manager pool: A large collection of buffers (32 KiBytes) that are used by all runtime algorithms whenever they need to buffer records. Records are stored in serialized form in those blocks.
The memory manager allocates these buffers at startup. - Remaining (Free) Heap: This part of the heap is left to the user code and the TaskManager's data structures. Since those data structures are rather small, that memory is mostly available to the user code.
JVM Heap 分成3块,
free,比较小的一块,给user code用的
memory manager pool, 管理大量的memory segments,32kb,用于耗费内存的operator
network buffers,用于网络传输buffer数据的,默认是2048个32kb的buffers
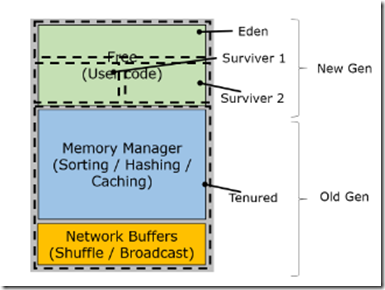
While allocating the network and MemoryManager buffers, the JVM usually performs one or more full garbage collections.
This adds some time to the TaskManager's startup, but saves in garbage collection time later, when tasks are executed.
Both the network buffers and the Memory Manager buffers live throughout the entire life of a TaskManager.
They move to the tenured generation of the JVM's internal memory regions and become long live, non-collected objects.
在分配network and MemoryManager buffers的时候,JVM往往会执行多次的full gc,这样会使TaskManager的startup时间变长,但是可以避免后续执行中的gc;
这些buffers会在TaskManager的整个生命周期中存活,所以会进入JVM的年老代,不会被回收;
Notes:
- The size of the buffers can be adjusted via
"taskmanager.network.bufferSizeInBytes", but 32K seems to be a good size for most setups. - There are ideas about how to unify the NetworkBuffer Pool and the Memory Manager region.
- There are ideas to add a mode that makes the allocation of the memory buffers by the MemoryManager lazy (allocated when needed). This decreases the startup time of the TaskManager, but will cause more garbage collections later when the buffers are actually allocated.
buffer size可以调整,但32k视乎是个不错的选择
NetworkBuffer Pool and the Memory Manager 是否可以统一管理,不要分两部分
MemoryManager是否可以lazy来allocate他管理的buffer,这样会降低startup,但是后续lazy allocate的时候会导致gc
Memory Segments
Flink represents all its memory as a collection of Memory Segments. The segment represents a region of memory (by default 32 KiBytes) and
provides methods to access the data at offsets (get and put longs, int, bytes, copy between segments and arrays, ...).
You can think of it as a version of the java.nio.ByteBuffer that is specialized for Flink (see below why we are not using the java.nio.ByteBuffer).
Impact on Garbage Collection
This mechanism of using memory has good implications on the garbage collection behavior of Flink.
Flink does not gather any records as objects, but stores them serialized inside the long lived buffers. That means there
are effectively no long-lived records - records exist only to be passed through user functions and to be serialized into
the memory segments. The long lived objects are the memory segments themselves, which are never garbage collected.
Akka and Actors
This page discusses the implementation of Flink's distributed communication via Akka, which has been adopted in version 0.9.
With Akka, all remote procedure calls are now realized as asynchronous messages.
This mainly affects the componentsJobManager, TaskManager and JobClient.
In the future, it is likely that even more components will be transformed into an actor, allowing them to send and process asynchronous messages.
Actors in Flink
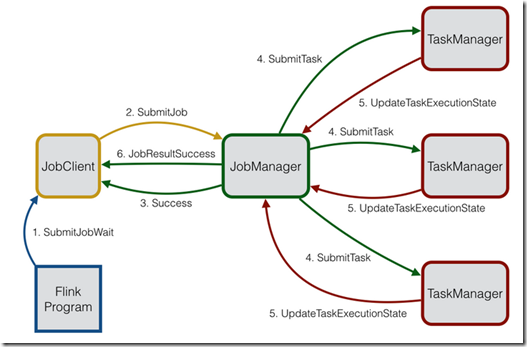
The Flink system consists of three distributed components which have to communicate: The JobClient, the JobManager and the TaskManager.
The JobClient takes a Flink job from the user and submits it to the JobManager.
The JobManager is then responsible for orchestrating the job execution. First of all, it allocates the required amount of resources. This mainly includes the execution slots on the TaskManagers.
After resource allocation, the JobManager deploys the individual tasks of the job to the respective TaskManagers Upon receiving a task, the TaskManager spawns a thread which executes the task.
State changes such as starting the calculation or finishing it are sent back to the JobManager. Based on these state updates, the JobManager will steer the job execution until it is finished. Once the job is finished, the result of it will be sent back to the JobClient which tells the user about it. The job execution process is depicted in the figure below.
Failure Detection
Failure detection in a distributed system is crucial for its robustness. When running on a commodity cluster, it can always happen that some of the components fail or are no longer reachable.
The reasons for such a failure are polymorphic and can reach from hardware breakdown to network outages. A robust distributed system should be able to detect failed components and recover from it.
Flink detects failed components by using Akka's DeathWatch mechanism.
DeathWatch allows actors to watch other actors even though they are not supervised by this actor or even living in a different actor system.
Once a watched actor dies or is no longer reachable, a Terminated message is sent to the watching actor.
Consequently, upon receiving such a message, the system can take steps against it.
Internally, the DeathWatch is realized as heartbeat and a failure detector which, based on the heartbeat-interval, hearbeat-pause and failure threshold, estimates when an actor is likely to be dead.
The heartbeat-interval can be controlled by setting the "akka.watch.heartbeat.interval" value in the configuration.
The acceptable heartbeat-pause can be specified via "akka.watch.heartbeat.pause". The heartbeat-pause should be a multiple of the heartbeat-interval, otherwise a lost heartbeat directly triggers the DeathWatch.
The failure threshold can be specified via"akka.watch.threshold" and it effectively controls the sensitivity of the failure detector.
More details about the DeathWatch mechanism and the failure detector can be found here.
In Flink, the JobManager watches all registered TaskManagers and the TaskManagers watch the JobManager.
This way, both components know when the other component is no longer reachable.
The JobManager reacts by marking the respective TaskManager as dead which prevents that future tasks are deployed to it.
Moreover, it fails all tasks which are currently running on this task manager and reschedules their execution on a different TaskManager.
In case that the TaskManager was only marked dead because of a temporary connection loss, then it can simply re-register itself at the JobManager once the connection has been re-established.
The TaskManager also watches the JobManager. This monitoring allows the TaskManager to enter a clean state by failing all currently running tasks when it detects a failed JobManager.
Additionally, the TaskManager will try to reconnect to the JobManager in case that the triggered death was only caused by network congestion or a connection loss.
首先,component之间如何判断大家是否活着,一般都是通过心跳,很多分布式系统都是用zk的临时节点来实现心跳机制
这里是用Akka自身的DeathWatch机制,该机制允许actor之间互相watch,就算没有supervised的关系,或者不同的actor system中,也可以互相watch
DeathWatch的实现仍然是基于心跳机制;
在Flink中,JobManager 和 TaskManagers 是互相watch的;
如果某个task manager挂了,job manager会把它标注成dead,并且把跑在上面的tasks重新schedule到其他的task manager。
Data exchange between tasks
Data exchange in Flink is built around the following design principles:
- The control flow for data exchange (i.e., the message passing in order to initiate the exchange) is receiver-initiated, much like the original MapReduce.
- The data flow for data exchange, i.e., the actual transfer of data over the wire is abstracted by the notion of an IntermediateResult, and is pluggable. This means that the system can support both streaming data transfer and batch data transfer with the same implementation.
Data exchange involves several objects, including:
JobManager, the master node, is responsible for scheduling tasks, recovery, and coordination, and holds the big picture of a job via the ExecutionGraph data structure.
TaskManagers, the worker nodes. A TaskManager (TM) executes many tasks concurrently in threads.
Each TM also contains one CommunicationManager (CM - shared between tasks), and one MemoryManager (MM - also shared between tasks).
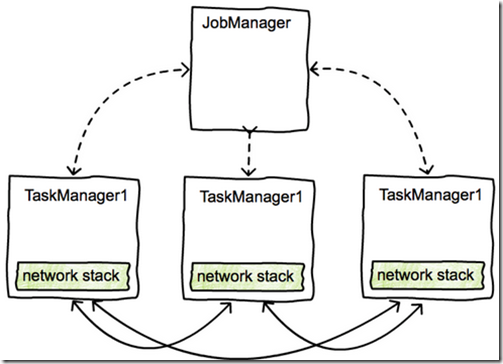
TMs can exchange data with each other via standing TCP connections, which are created when needed.
Note that in Flink, it is TaskManagers, not tasks, that exchange data over the network, i.e., data exchange between tasks that live in the same TM is multiplexed over one network connection.
data exchange主要包含,控制流和数据流,
控制流,主要是JobManager和TaskManager之前的数据交互;
数据流,在Flink中,是TaskManager而非task本身,通过CommunicationManager来传输数据;
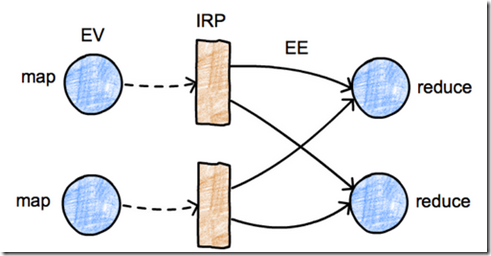
ExecutionGraph: The execution graph is a data structure that contains the “ground truth” about the job computation.
It consists of vertices (EV,ExecutionVertex) that represent computation tasks, and intermediate results (IRP,IntermediateResultPartition), that represent data produced by tasks.
Vertices are linked to the intermediate results they consume via ExecutionEdges (EE):
These are logical data structures that live in the JobManager. They have their runtime equivalent structures that are responsible for the actual data processing that live at the TaskManagers. The runtime equivalent of the IntermediateResultPartition is called ResultPartition.
ResultPartition (RP) represents a chunk of data that a BufferWriter writes to, i.e., a chunk of data produced by a single task. A RP is a collection of Result Subpartitions (RSs). This is to distinguish between data that is destined to different receivers, e.g., in the case of a partitioning shuffle for a reduce or a join.
ResultSubpartition (RS) represents one partition of the data that is created by an operator, together with the logic for forwarding this data to the receiving operator.
The specific implementation of a RS determines the actual data transfer logic, and this is the pluggable mechanism that allows the system to support a variety of data transfers.
For example, the PipelinedSubpartition is a pipelined implementation to support streaming data exchange. The SpillableSubpartition is a blocking implementation to support batch data exchange.
InputGate: The logical equivalent of the RP at the receiving side. It is responsible for collecting buffers of data and handing them upstream.
InputChannel: The logical equivalent of the RS at the receiving side. It is responsible for collecting buffers of data for a specific partition.
上面图中,表示出在JobManager中的逻辑数据结构,当然这TaskManager中有其对应的runtime结构;
在发送端,producer,IRP对应于ResultPartition (RP),而RP又是由一组Result Subpartitions (RSs)组成的;这里不同的实现,会有不同的传输方式,比如PipelinedSubpartition,就会实现一种streaming的数据exchange
在接收端,对应的结构是,InputGate,然后InputGate又由一组InputChannel组成
Control flow for data exchange
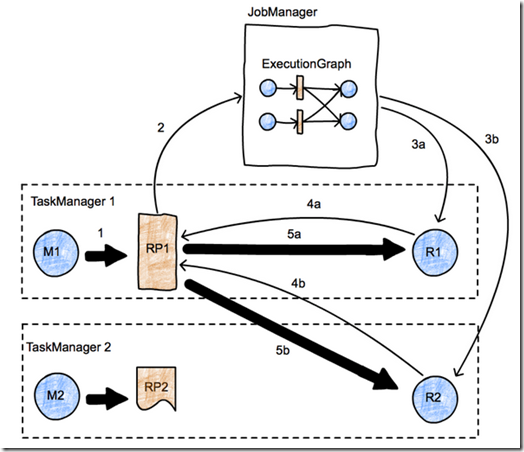
The picture represents a simple map-reduce job with two parallel tasks.
We have two TaskManagers, with two tasks each (one map task and one reduce task) running in two different nodes, and one JobManager running in a third node.
We focus on the initiation of the transfer between tasks M1 and R2.
Data transfers are represented using thick arrows, and messages are represented using thin arrows.
First, M1 produces a ResultPartition (RP1) (arrow 1).
When the RP becomes available for consumption (we discuss when this is later), it informs the JobManager (arrow 2).
The JobManager notifies the intended receivers of this partition (tasks R1 and R2) that the partition is ready.
If the receivers have not been scheduled yet, this will actually trigger the deployment of the tasks (arrows 3a, 3b).
Then, the receivers will request data from the RP (arrows 4a and 4b).
This will initiate the data transfer between the tasks (arrows 5a and 5b), either locally (case 5a), or passing through the network stack of the TaskManagers (5b).
This process leaves as a degree of freedom the when a RP decides to inform the JobManager of its availability.
For example, if RP1 fully produces itself (and is perhaps written to a file) before informing the JM, the data exchange corresponds roughly to a batch exchange as implemented in Hadoop. If the RP1 informs the JM as soon as its first record is produced, we have a streaming data exchange.
图中反映出一个简单的map-reduce job的控制流,比较容易理解
这里需要注意的是,PR1可以自由的决定何时通知JobManager,它已ready;如果当RP1完全生成完后,再通知,就是batch的data exchange,如果当生成第一条record时就通知,就是streaming data exchage
Transfer of a byte buffer between two tasks
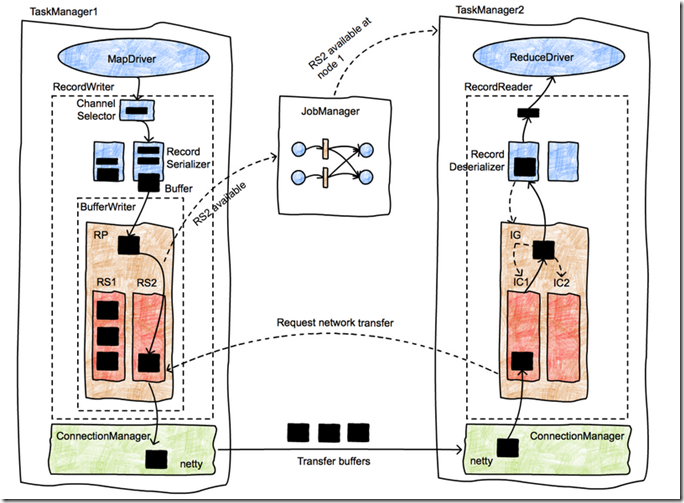
This picture presents in more detail the lifetime of data records as they are shipped from a producer to a consumer.
Initially the MapDriver is producing records (collected by a Collector) that are passed to a RecordWriter object.
RecordWriters contain a number of serializers (RecordSerializer objects), one per consumer task that will possibly consume these records. For example, in a shuffle or broadcast, there will be as many serializers as the number of consumer tasks. A ChannelSelector selects one or more serializers to place the record to. For example, if records are broadcast, they will be placed in every serializer. If records are hash-partitioned, the ChannelSelector will evaluate the hash value on the record and select the appropriate serializer.
The serializers serialize the records into their binary representation, and place them in fixed-size buffers (records can span multiple buffers).
These buffers and handed over to a BufferWriter and written out to an ResultPartition (RP).
The RP consists of several subpartitions (ResultSubpartitions - RSs) that collect buffers for specific consumers.
In the picture, the buffer is destined for the second reducer (in TaskManager 2), and it is placed in RS2.
Since this is the first buffer, RS2 becomes available for consumption (note that this behavior implements a streaming shuffle), and notifies the JobManager of the fact.
The JobManager looks up the consumers of RS2, and notifies TaskManager 2 that a chunck of data is available.
The message to TM2 is propagated down to the InputChannel that is supposed to receive this buffer, which in turn notifies RS2 that a network transfer can be initiated.
Then, RS2 hands over the buffer to the network stack of TM1, which in turns hands it over to netty for shipping. Network connections are long-running and exist between TaskManagers, not individual tasks.
Once the buffer is received by TM2, it passes through a similar object hierarchy, starting at the InputChannel (the receiver-side equivalent to the IRPQ), going to the InputGate (which contains several ICs), and finally ending up in a RecordDeserializer that produces typed records from buffers and hands them over to the receiving task, in this case a ReduceDriver.
