https://engineering.linkedin.com/kafka/running-kafka-scale
If data is the lifeblood of high technology, Apache Kafka is the circulatory system in use at LinkedIn. We use Kafka for moving every type of data around between systems, and it touches virtually every server, every day. The complexity of the infrastructure, as well as the reasoning behind choices that have been made in its implementation, has developed out of a need to move a large amount of data around quickly and reliably.
如果把kafka作为一个公司的infrastructure,如何规模的使用和运维
What is Kafka?
Apache Kafka is a publish/subscribe messaging system with a twist: it combines queuing with message retention on disk. Think of it as a commit log that is distributed over several systems in a cluster. Messages are organized into topics and partitions, and each topic can support multiple publishers (producers) and multiple subscribers (consumers). Messages are retained by the Kafka cluster in a well-defined manner for each topic:
- For a specific amount of time (measured in days at LinkedIn)
- For a specific total size of messages in a partition
- Based on a key in the message, storing only the most recent message per key
There have been many papers and talks on Kafka, including a talk given at ApacheCon 2014 by Clark Haskins and myself. If you are not yet familiar with Kafka, you may want to check those links out to learn the basics of how it operates.
How Big is Big?
Kafka itself is not concerned with the content of the messages themselves. Data of many different types can easily coexist on the same cluster, divided into topics for each type of data. Producers and consumers only need to concern themselves with the topics they are interested in.
LinkedIn goes one step further, and defines four categories of messages: queuing, metrics, logs and tracking data that each live in their own cluster.
When combined, the Kafka ecosystem at LinkedIn is sent over 800 billion messages per day which amounts to over 175 terabytes of data. Over 650 terabytes of messages are then consumed daily, which is why the ability of Kafka to handle multiple producers and multiple consumers for each topic is important. At the busiest times of day, we are receiving over 13 million messages per second, or 2.75 gigabytes of data per second. To handle all these messages, LinkedIn runs over 1100 Kafka brokers organized into more than 60 clusters.
LinkedIn 进一步把message分为4类, queuing, metrics, logs and tracking
在LinkedIn内部的规模,
数据量,
800 billion messages per day, 175 terabytes
650 terabytes of messages are then consumed ,也就是说一份数据会被消费4遍
peak,13 million messages per second, or 2.75 gigabytes
kafka规模,
1100 Kafka brokers organized into more than 60 clusters,平均每个cluster,20台左右的kafka
Queuing
Queuing is the standard messaging type that most people think of: messages are produced by one part of an application and consumed by another part of that same application. Other applications aren't interested in these messages, because they're for coordinating the actions or state of a single system. This type of message is used for sending out emails, distributing data sets that are computed by another online application, or coordinating with a backend component.
Metrics
Metrics handles all measurements generated by applications in their operation. It includes everything from OS and hardware statistics to application-specific measurements which are critical to ensuring the proper functioning of the system. This is the eyes and ears of LinkedIn, providing visibility into the status of all servers and applications, and driving our internal monitoring and alerting systems. If you’d like to know more about our metrics, you can read about the original design of our Autometrics system, as well as a recent post by Stephen Bisordi on where Autometrics is headed next.
Logging
Logging includes application, system, and public access logs. Originally, metrics and logging coexisted on the same cluster for convenience. We now keep logging data separate simply because of how much there is. The logging data is produced into Kafka by applications, and then read by other systems for log aggregation purposes.
Tracking
Tracking includes every action taken on the front lines of LinkedIn's infrastructure, whether by users or applications. These actions need to be communicated to other applications as well as to stream processing in Apache Samza and batch processing in Apache Hadoop. This is the bread and butter of big data: the information we need to keep search indices up to date, track usage of paid services, and measure numerous growth vectors in real time. All four types of messaging are critically important to the proper functioning of LinkedIn, however tracking data is the most visible as it is often seen at the executive levels and is what drives revenue.
Tiers and Aggregation
Like all large websites, LinkedIn operates out of multiple datacenters. Some applications, such as those serving a specific user's requests, are only concerned with what is going on in a single datacenter. Many other applications, such as those maintaining the indices that enable search, need a view of what is going on in all datacenters.
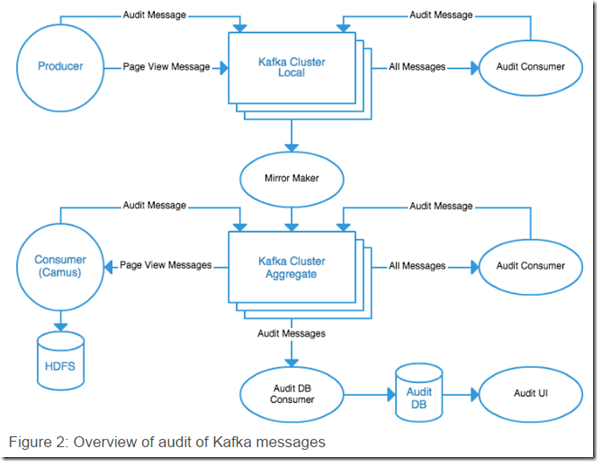
For each message category, LinkedIn has a cluster named local containing messages created in the datacenter. There is also an aggregate cluster, which combines messages from all local clusters for a given category. We use the Kafka mirror maker application to copy messages forward, from local into aggregate. This avoids any message loops between local clusters.
Moving the data within the Kafka infrastructure reduces network costs and latency by allowing us to copy the messages a minimum number of times (once per datacenter). Consumers access the data locally, which simplifies their configuration and allows them to not worry about many types of cross-datacenter network problems. The producer and consumer complete the concept of tiers within our Kafka infrastructure. The producer is the first tier, the local cluster (across all datacenters) is the second, and each of the aggregate clusters is an additional tier. The consumer itself is the final tier.
This tiered infrastructure solves many problems, but it greatly complicates monitoring Kafka and assuring its health. While a single Kafka cluster, when running normally, will not lose messages, the introduction of additional tiers, along with additional components such as mirror makers, creates myriad points of failure where messages can disappear. In addition to monitoring the Kafka clusters and their health, we needed to create a means to assure that all messages produced are present in each of the tiers, and make it to the critical consumers of that data.
每个数据中心,除了一个local cluster,还需要要一个aggregate cluster来汇总全局数据
这样做的好处的是,所以数据在各个数据中心之间只需要同步一遍,不需要每次用到都去拖,这样大大降低了网络流量和延迟;
但是问题是大大增加了整个系统的复杂度,数据的管理处于不可控的状况,任意一个节点失败都会导致数据丢失
Auditing Completeness
Kafka Audit is an internal tool at LinkedIn that helps to make sure all messages produced are copied to every tier without loss.
Message schemas contain a header containing critical data common to every message, such as the message timestamp, the producing service, and the originating host. As an individual producer sends messages into Kafka, it keeps a count of how many messages it has sent during the current time interval. Periodically, it transmits that count as a message to a special auditing topic. This gives us information about how many messages each producer attempted to send into a specific topic.
首先,在每个message里面都会加上一个header,放一些元数据用于tracker;producer在发送数据的时候,会持续统计单位时间发送多少条messages,并会将结果以audit message的形式发送到auditing topic;
One of our Kafka infrastructure applications, called the Kafka Console Auditor, consumes all messages from all topics in a single Kafka cluster.
Like the producer, it periodically sends messages into the auditing topic stating how many messages it consumed from that cluster for each topic for the last time interval.
By comparing these counts to the producer counts, we are able to determine that all of the messages produced actually got to Kafka.
If the numbers differ, then we know that a producer is having problems, and we are able to trace that back to the specific service and host that is failing.
Each Kafka cluster has its own console auditor that verifies its messages. By comparing each tier's counts against each other, we can assure that every tier has the same number of messages present.
This assures that we have neither loss, nor duplication, of messages and can take immediate action if there is a problem.
每个Kafka集群都有个Kafka Console Auditor,会去消费所有topics的所有的messages,并且去统计收到的消息数,也会将结果通过audit message发送到auditing topic里面去;
这样对比producer和consumer的统计数据,就可以知道是否丢失数据,是否多数据
Bringing It All Together
This may seem like a lot of complexity to layer on top of a simple Kafka cluster -- giving us an overwhelming task of making sure that all applications at LinkedIn do things the same way -- but we have an ace in the hole.
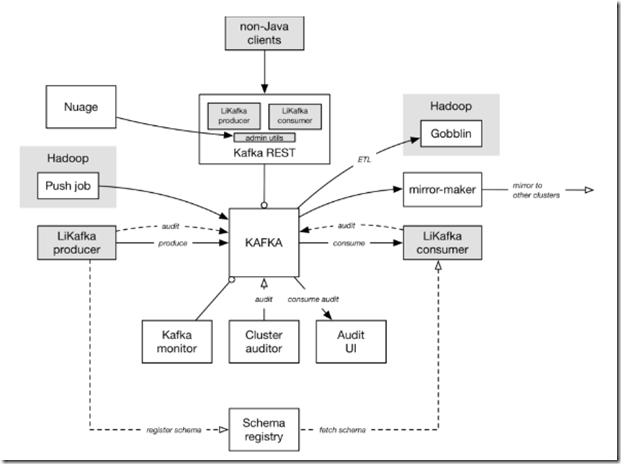
LinkedIn has a Kafka engineering team comprised of some of the top open source Kafka developers. They provide internal support to LinkedIn's development community, assisting them with using Kafka in a consistent and maintainable manner. They are a common point of contact for anyone who wants to know how to implement a producer or consumer, or deep dive into specific design concerns around how to use Kafka in the best way for their application.
The Kafka development team also provides an additional benefit for LinkedIn, which is a set of custom libraries that layer over the open source Kafka libraries and tie all of the extras together.
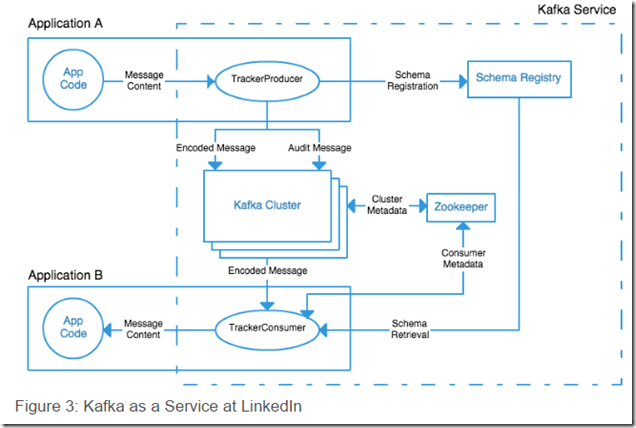
For example, almost all producers of Kafka messages within LinkedIn use a library called TrackerProducer. When the application calls it to send a message, it takes care of inserting message header fields, schema registration, as well as tracking and sending the auditing messages. Likewise, the consumer library takes care of fetching schemas from the registry and deserializing Avro messages. The majority of the Kafka infrastructure applications, such as the console auditor, are also maintained by the development team.
比如在linkedin,所有producer发送数据都是通过TrackerProducer,它会封装所有的事情,比如往message里面插入header,注册schema,tracking和发送auditing消息;
https://engineering.linkedin.com/blog/2016/04/kafka-ecosystem-at-linkedin
https://engineering.linkedin.com/apache-kafka/burrow-kafka-consumer-monitoring-reinvented
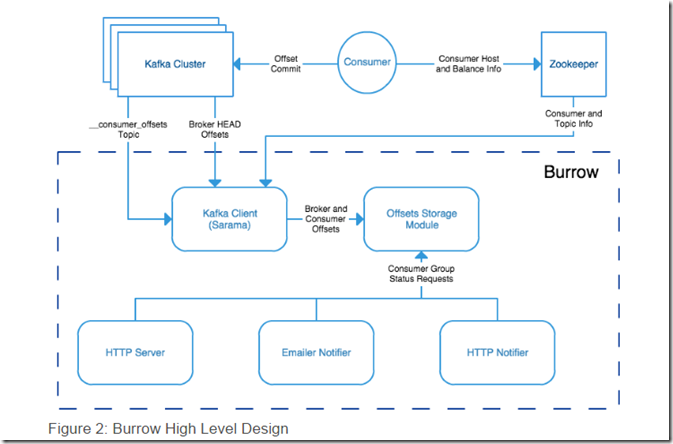
kafka, offset manager
https://engineering.linkedin.com/blog/2016/05/kafkaesque-days-at-linkedin--part-1
http://www.slideshare.net/jjkoshy/offset-management-in-kafka


