简介
目前有许许多多的lib、应用可以将已经广泛使用的通用组件对应的指标转换成Prometheus指定的指标格式(普通的文本),来帮助使用者利用Prometheus来监控这些组件,例如Kafka、mysql、HAProxy等。这些lib、应用被称为exporter。本章节我们通过Prometheus官方维护的node-exporter(用来监控Linux系统指标)来进一步学习Prometheus
node-exporter安装
node-exporter采用go语言开发,专门用来收集*NIX系统中硬件、系统指标。既可以用二进制安装部署,也可以通过容器形式部署
二进制安装
-
进入下载页,获取相应版本的下载链接
-
以0.18.1版本为例
$ mkdir /opt/k8s/prometheus & cd /opt/k8s/prometheus $ wget https://github.com/prometheus/node_exporter/releases/download/v0.18.1/node_exporter-0.18.1.linux-amd64.tar.gz $ tar -xzvf node_exporter-0.18.1.linux-amd64.tar.gz $ cd node_exporter-0.18.1.linux-amd64 $ls -al 总用量 16508 drwxr-xr-x 2 3434 3434 4096 6月 5 2019 . drwxr-xr-x 4 root root 4096 3月 19 09:18 .. -rw-r--r-- 1 3434 3434 11357 6月 5 2019 LICENSE -rwxr-xr-x 1 3434 3434 16878582 6月 5 2019 node_exporter -rw-r--r-- 1 3434 3434 463 6月 5 2019 NOTICE- node_exporter 安装包极其简单,只有一个二进制启动文件
-
启动node_exporter
$ cd /opt/k8s/prometheus/node_exporter-0.18.1.linux-amd64 $ ./node_exporter-
执行./node_exporter -h 命令查看node_exporter的配置项,如监听端口,收集指标类型
-
node_exporter监听端口9100,通过--web.listen-address参数修改
-
node_exporter默认采用http协议,如果需要用https形式启动,通过./node_exporter --web.config="web-config.yml"指定,web-config.yml文件格式如下:
tlsConfig :
  # Certificate and key files for server to use to authenticate to client
  tlsCertPath : <filename>
  tlsKeyPath : <filename>
-
-
将node_exporter配置成系统服务,随系统启动
-
编辑启动文件
$ cat > /etc/systemd/system/node_exporter.service<< EOF [Unit] Description=Prometheus Server Documentation=https://prometheus.io/docs/introduction/overview/ After=network.target [Service] Restart=on-failure WorkingDirectory=/opt/k8s/prometheus/node_exporter-0.18.1.linux-amd64 ExecStart=/opt/k8s/prometheus/node_exporter-0.18.1.linux-amd64/node_exporter [Install] WantedBy=multi-user.target EOF -
通过systemctl启动node_exporter
$ systemctl daemon-reload
$ systemctl start node_exporter
$ systemctl enable node_exporter
-
docker 容器形式启动
因为node_exporter是用来监控主机指标的,一般情况下不太推荐用容器方式启动,但是在k8s、swarm等环境中,为了保持组件部署的一致性我们还是期望能用容器形式启动。另外在k8s中以daemonset,在swarm中将service的replicate设置成all,这样我们当系统中有新节点进来时,node_exporter容器会自动在新节点上启动,不需要人工干预。
由于需要监控宿主机指标,所以需要使用宿主机的process、文件系统、网络等信息,因为需要把宿主机的信息挂载进去
docker run -d
  --net="host"
  --pid="host"
  -v "/:/host:ro,rslave"
  quay.io/prometheus/node-exporter
  --path.rootfs=/host
配置Prometheus,从node_exporter中获取指标信息
-
在Prometheus配置文件中追加node_exporter对应的scrape_config信息
... scrape_configs: - job_name: 'node' static_configs: - targets: ['localhost:9100'] -
通过kill -HUP 重新加载Prometheus配置文件
$ systemctl reload prometheus -
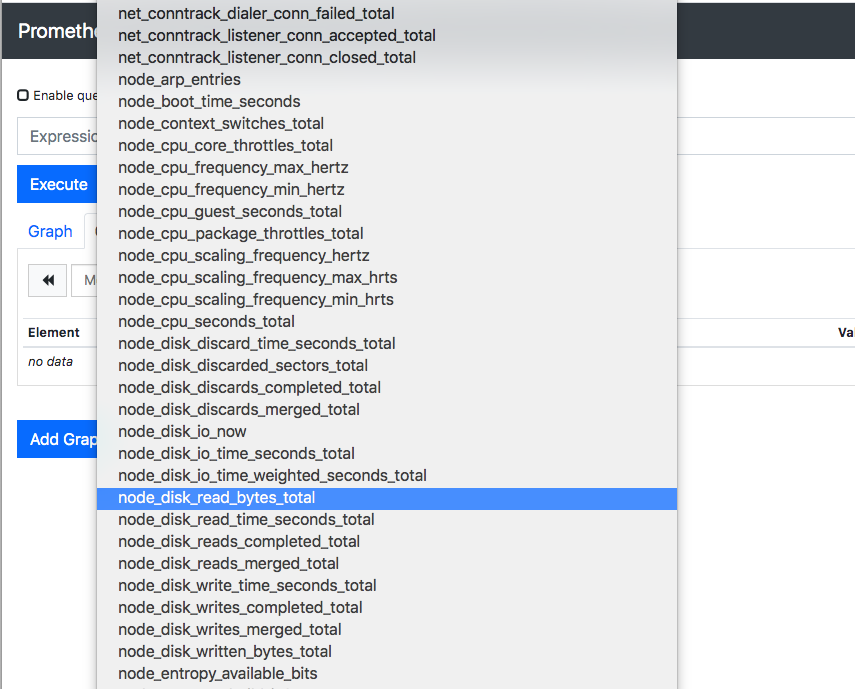
访问Prometheus界面,在metric下拉框中可以看到许多与node相关的指标名字出现