zoukankan      html  css  js  c++  java
  • Echarts作图之饼状图联动

    Echarts版本:2.2.7

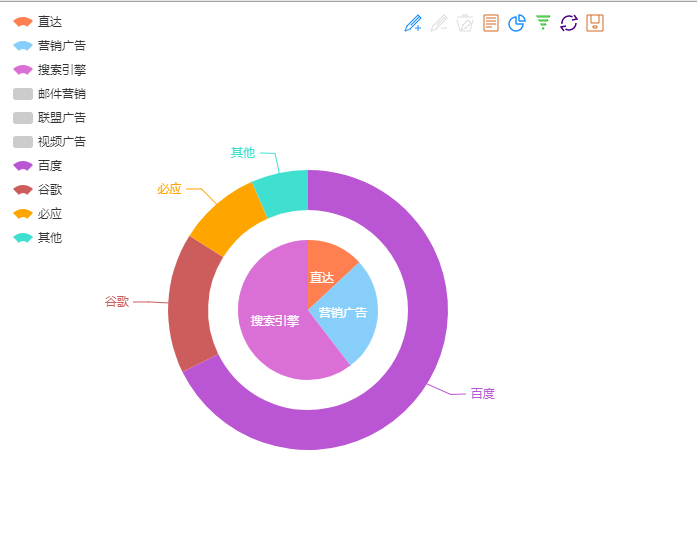
    具体思路,通过对饼状图对象注册ecConfig.EVENT.PIE_SELECTED事件,对饼状图点击的块进行判断,根据需求改变series中的对象以及对象中的数据,从而进行改变饼状图的层的展示,如下图所示(数据来自官方网站),点击同心圆最里层的不同部分会显示不同的数据

    代码如下:

    <!DOCTYPE html>
    <html>
    
    <head>
        <title></title>
        <style type="text/css">
        #platoBox {
             600px;
            height: 600px;
        }
        </style>
        <script src="http://echarts.baidu.com/build/dist/echarts.js"></script>
        <script type="text/javascript">
        window.onload = function() {
            // 路径配置
            require.config({
                paths: {
                    echarts: 'http://echarts.baidu.com/build/dist'
                }
            });
    
            require([
                'echarts',
                'echarts/chart/pie'
            ], function(ec) {
                var dom = document.getElementById("platoBox");
                var myChart = ec.init(dom);
                option = {
                    tooltip: {
                        trigger: 'item',
                        formatter: "{a} <br/>{b} : {c} ({d}%)"
                    },
                    legend: {
                        orient: 'vertical',
                        x: 'left',
                        data: ['直达', '营销广告', '搜索引擎', '邮件营销', '联盟广告', '视频广告', '百度', '谷歌', '必应', '其他']
                    },
                    toolbox: {
                        show: true,
                        feature: {
                            mark: { show: true },
                            dataView: { show: true, readOnly: false },
                            magicType: {
                                show: true,
                                type: ['pie', 'funnel']
                            },
                            restore: { show: true },
                            saveAsImage: { show: true }
                        }
                    },
                    calculable: false,
                    series: [{
                            name: '访问来源',
                            type: 'pie',
                            selectedMode: 'single',
                            radius: [0, 70],
    
                            // for funnel
                            x: '20%',
                             '40%',
                            funnelAlign: 'right',
                            max: 1548,
    
                            itemStyle: {
                                normal: {
                                    label: {
                                        position: 'inner'
                                    },
                                    labelLine: {
                                        show: false
                                    }
                                }
                            },
                            data: [
                                { value: 335, name: '直达' },
                                { value: 679, name: '营销广告' },
                                { value: 1548, name: '搜索引擎'}
                            ]
                        },
                        {
                            name: '访问来源',
                            type: 'pie',
                            radius: [100, 140],
    
                            // for funnel
                            x: '60%',
                             '35%',
                            funnelAlign: 'left',
                            max: 1048,
    
                            data: [
                               
                            ]
                        }
                    ]
                };
    
                myChart.setOption(option);
    
                var ecConfig = require('echarts/config');
                myChart.on(ecConfig.EVENT.PIE_SELECTED, function(param) {
                    var selected = param.selected;
                    var serie;
                    for (var idx in selected) { //idx指示具体是哪一个同心圆,其中最里面的同心圆是'0',注意该值是字符串
                        serie = option.series[idx];
                        for (var i = 0, l = serie.data.length; i < l; i++) {
                            //i代表同一个同心圆第几部分,即series中data的第几条数据
                            if (selected[idx][i]) {
                                //通过对idx和i值的判断,可以确定点击的是哪一部分,然后对option进行操作
                                if (idx === "0") {
                                    if (i === 0) {
                                        option.series[1].data = [{ value: 335, name: '直达' }];
                                    } else if (i === 1) {
                                        option.series[1].data = [
                                            { value: 310, name: '邮件营销' },
                                            { value: 234, name: '联盟广告' },
                                            { value: 135, name: '视频广告' }
                                        ];
                                    } else{
                                        option.series[1].data = [
                                            { value: 1048, name: '百度' },
                                            { value: 251, name: '谷歌' },
                                            { value: 147, name: '必应' },
                                            { value: 102, name: '其他' }
                                        ];
                                    }
                                }
                            }
                        }
                    }
                    myChart.setOption(option, true);
                })
    
            })
        }
        </script>
    </head>
    
    <body>
        <div id="platoBox">
        </div>
    </body>
    
    </html>


  • 相关阅读:
    table中tr间距的设定table合并单元格 colspan(跨列)和rowspan(跨行)
    使用jquery触发a标签跳转
    真正的让iframe自适应高度 兼容多种浏览器随着窗口大小改变
    html5 data属性的使用
    jQuery取得select选择的文本与值
    jqueryui教程
    密码复杂度
    zabbix配置微信报警
    tomcat配置域名访问
    阿里云ecs禁止ping,禁止telnet
  • 原文地址:https://www.cnblogs.com/gebizhuifenren/p/7745705.html
Copyright © 2011-2022 走看看