维基百科
创建数组
To create an array with four elements in a single row, separate the elements with either acomma (,) or a space.
a = [1 2 3 4]%行向量
To create a matrix that has multiple rows, separate the rows with semicolons.
a = [1 2 3; 4 5 6; 7 8 10]%矩阵
Another way to create a matrix is to use a function, such as ones, zeros, or rand. For example, create a 5-by-1 column vector of zeros.
z = zeros(5,1)%五行一列的零向量
Matrix and Array Operations
MATLAB allows you to process all of the values in a matrix using a single arithmetic operator or function.
a + 10
ans =

    11    12    13
    14    15    16
    17    18    20
sin(a)
ans =

    0.8415    0.9093    0.1411
   -0.7568   -0.9589   -0.2794
    0.6570    0.9894   -0.5440
To transpose a matrix, use a single quote ('):
a'//矩阵a的转置
ans =

     1     4     7
     2     5     8
     3     6    10
p = a*inv(a)//A乘上A逆矩阵得到单位矩阵
p = a.*a%A的对应元素相乘,也叫点乘
p = a.^3//将A中所有元素三次方
矩阵的两种连接
Concatenation is the process of joining arrays to make larger ones. In fact, you made your first array by concatenating its individual elements. The pair of square brackets [] is the concatenation operator.
A = [a,a]
A =

     1     2     3     1     2     3
     4     5     6     4     5     6
     7     8    10     7     8    10
Concatenating arrays next to one another using commas is called horizontal concatenation. Each array must have the same number of rows. Similarly, when the arrays have the same number of columns, you can concatenate vertically using semicolons.
A = [a; a]
A =

     1     2     3
     4     5     6
     7     8    10
     1     2     3
     4     5     6
     7     8    10
矩阵的访问
A = magic(4)//四阶幻方矩阵或者魔方矩阵
A =
    16     2     3    13
     5    11    10     8
     9     7     6    12
     4    14    15     1
A(4,2)
ans =
    14
如果访问越界会报错
test = A(4,5) //错误
但是
A(4,5) = 17//被赋值时正确,此时A矩阵变成
A =
    16     2     3    13     0
     5    11    10     8     0
     9     7     6    12     0
     4    14    15     1    17
To refer to multiple elements of an array, use the colon operator, which allows you to specify a range of the form start:end. For example, list the elements in the first three rows and the second column of A:
A(1:3,2)//第二列的1~3行
ans =
     2
    11
     7
The colon alone, without start or end values, specifies all of the elements in that dimension. For example, select all the columns in the third row of A:
A(3,:)//第三行的所有
ans =
     9     7     6    12     0
The colon operator also allows you to create an equally spaced vector of values using the more general form start:step:end.
B = 0:10:100
B =

     0    10    20    30    40    50    60    70    80    90   100
If you omit the middle step, as in start:end, MATLAB uses the default step value of 1.
save myfile.mat //存储工作区变量
load myfile.mat //载入工作区变量
Character Strings
A character string is a sequence of any number of characters enclosed in single quotes. You can assign a string to a variable.
myText = 'Hello, world';//字符串赋值
If the text includes a single quote, use two single quotes within the definition.
otherText = 'You''re right'//带有转义字符的字符串赋值
otherText =

You're right
myText and otherText are arrays, like all MATLAB® variables. Their class or data type is char, which is short for character.
whos myText
  Name        Size            Bytes  Class    Attributes

  myText      1x12               24  char
You can concatenate strings with square brackets 方括号, just as you concatenate numeric arrays.
longText = [myText,' - ',otherText]//单引号间可加任意字符
longText =

Hello, world - You're right
To convert numeric values to strings, use functions, such as num2str or int2str.
f = 71;
c = (f-32)/1.8;
tempText = ['Temperature is ',num2str(c),'C']
tempText =

Temperature is 21.6667C
函数调用
MATLAB® provides a large number of functions that perform computational tasks. Functions are equivalent to subroutines or methods in other programming languages.
To call a function, such as max, enclose its input arguments in parentheses(输入的参数会包含在括号中):
A = [1 3 5];
max(A);
If there are multiple input arguments, separate them with commas:
B = [10 6 4];
max(A,B);
Return output from a function by assigning it to a variable:
maxA = max(A);
When there are multiple output arguments, enclose them in square brackets:
[maxA,location] = max(A);//对于有多个返回值的函数,左值用方括号
Enclose any character string inputs in single quotes:
disp('hello world');
To call a function that does not require any inputs and does not return any outputs, type only the function name:
clc
The clc function clears the Command Window.
2-D and 3-D Plots
Line Plots
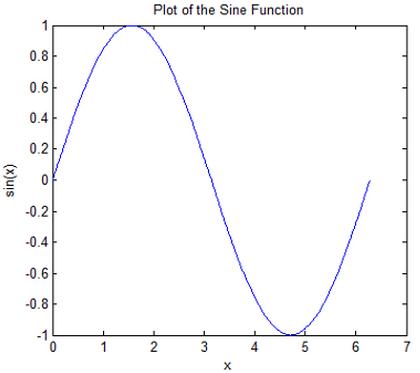
To create two-dimensional line plots, use the plot function. For example, plot the value of the sine function from 0 to 2π:
x = 0:pi/100:2*pi;
y = sin(x);
plot(x,y)//二维图像使用plot函数
You can label the axes and add a title.
xlabel('x')
ylabel('sin(x)')//给做标轴取名
title('Plot of the Sine Function')//给图像取名
By adding a third input argument to the plot function, you can plot the same variables using a red dashed line.
plot(x,y,'r--')//用red的虚线--表示图像
The 'r--' string is a line specification.(说明) Each specification can include characters for the line color, style, and marker. A marker is a symbol that appears at each plotted data point, such as a +,o, or *. For example, 'g:*' requests a dotted green line with * markers.
Notice that the titles and labels that you defined for the first plot are no longer in the current figure window. By default, MATLAB® clears the figure each time you call a plotting function, resetting the axes and other elements to prepare the new plot.
To add plots to an existing figure, use hold.
x = 0:pi/100:2*pi;
y = sin(x);
plot(x,y)

hold on

y2 = cos(x);
plot(x,y2,'r:')
legend('sin','cos')
Until you use hold off or close the window, all plots appear in the current figure window.
3-D Plots
Three-dimensional plots typically display a surface defined by a function in two variables, z = f (x,y).
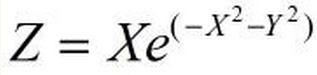
To evaluate z, first create a set of (x,y) points over the domain of the function using meshgrid.
[X,Y] = meshgrid(-2:.2:2); //先分割地平面
Z = X .* exp(-X.^2 - Y.^2);//2.71828用exp表示,它的次方不必使用^号
Then, create a surface plot.
surf(X,Y,Z)
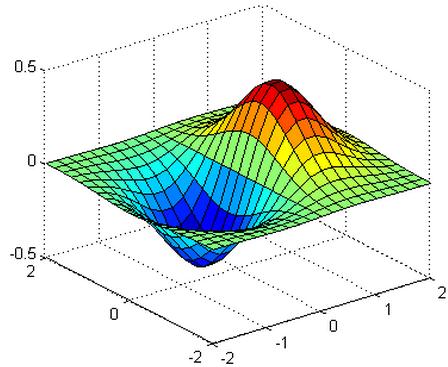
Both the surf function and its companion mesh display surfaces in three dimensions. surf displays both the connecting lines and the faces of the surface in color. mesh produces wireframe surfaces that color only the lines connecting the defining points.
Subplots
You can display multiple plots in different subregions of the same window using the subplot function.
For example, create four plots in a 2-by-2 grid within a figure window.
t = 0:pi/10:2*pi;
[X,Y,Z] = cylinder(4*cos(t));
subplot(2,2,1); mesh(X); title('X');
subplot(2,2,2); mesh(Y); title('Y');
subplot(2,2,3); mesh(Z); title('Z');
subplot(2,2,4); mesh(X,Y,Z); title('X,Y,Z');
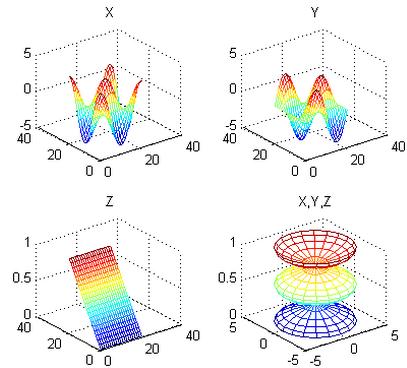
The first two inputs to the subplot function indicate the number of plots in each row and column. The third input specifies which plot is active.