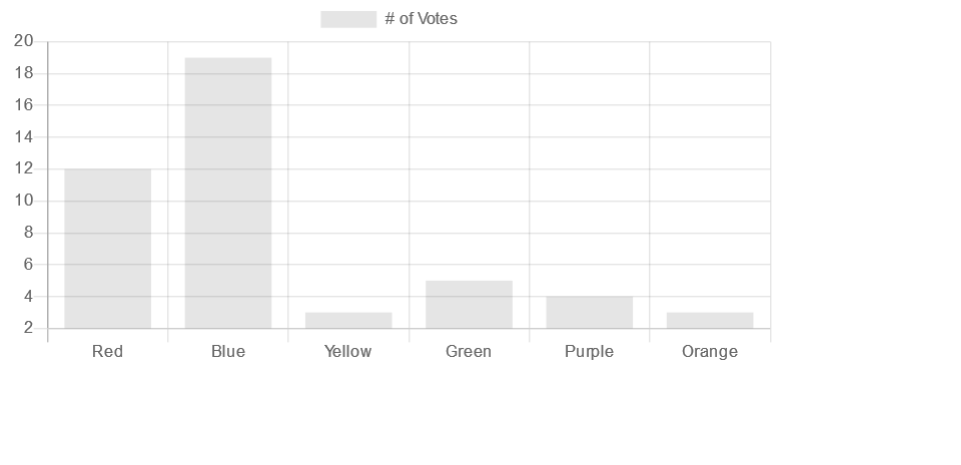
在上一节课中我们学习了如何利用chart.js画一个简单的柱状图(参见上节课ppt),在本次课中将向大家介绍如何改变柱状图的样式。首先,我们来改变柱状图的大小,代码如下:
1 <div class="chart-container" style="position: relative; height:40vh; 40vw">
2 <canvas id="myChart" ></canvas>
3 </div>
在上面的代码中,我们将canvas画布元素放在一对<div></div>标签中,通过改变div元素的大小来改变柱状图的大小。40vh的含义是占整个屏幕高度的40%,40vw的含义是占整个屏幕宽度的40%。
除了要把画布元素放在<div>容器里外,要想改变柱状图的大小还需要在构造函数的options对象属性(参见上节课的ppt)中加入以下两行代码:
1 options: {
2       responsive:true,
3     maintainAspectRatio: false
4     }
至此,我们可以等到一个缩小版的柱状图如下:

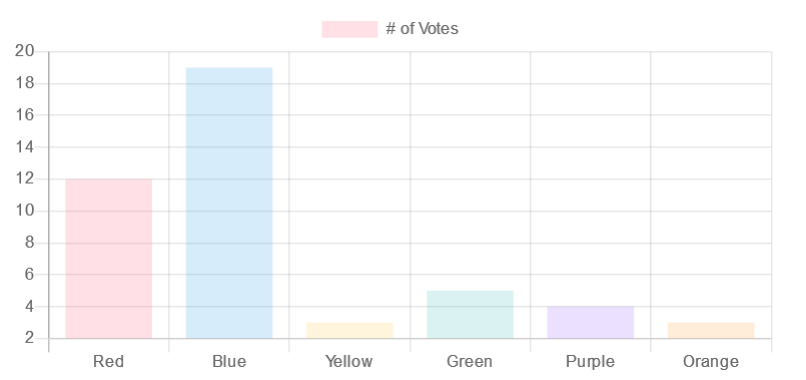
除了改变柱状图的大小,还可以改变柱状图中每个柱子的颜色,具体方法是在dataset对象(见上节课的ppt)的backgroundColor属性中指定每个柱子的颜色值,具体代码如下:
 1  datasets: [{
 2             label: '# of Votes',
 3             data: [12, 19, 3, 5, 4, 3],
 4             backgroundColor: [
 5                 'rgba(255, 99, 132, 0.2)',
 6                 'rgba(54, 162, 235, 0.2)',
 7                 'rgba(255, 206, 86, 0.2)',
 8                 'rgba(75, 192, 192, 0.2)',
 9                 'rgba(153, 102, 255, 0.2)',
10                 'rgba(255, 159, 64, 0.2)'
11             ],
12
13         }]
在上述代码中rgba函数可以指定红绿蓝三个颜色通道的数值以及指定透明度。柱状图的显示效果如下:

除了可以指定柱子的颜色外还可以通过dataset对象的borderWidth和borderColor属性指定柱子边框的粗细和颜色,代码如下:
 1 datasets: [{
 2             label: '# of Votes',
 3             data: [12, 19, 3, 5, 4, 3],
 4             backgroundColor: [
 5                 'rgba(255, 99, 132, 0.2)',
 6                 'rgba(54, 162, 235, 0.2)',
 7                 'rgba(255, 206, 86, 0.2)',
 8                 'rgba(75, 192, 192, 0.2)',
 9                 'rgba(153, 102, 255, 0.2)',
10                 'rgba(255, 159, 64, 0.2)'
11             ],
12             borderWidth:4,
13             borderColor:'black'
14         }]
显示效果如下:
在options属性中可以加入title属性(也是对象类型)来指定柱状图的标题,其中,fontSize可以设定标题的字号。代码如下:
1 options: {
2       responsive:true,
3     maintainAspectRatio: false,
4     title:{
5       display:true,
6       text:'My Favorite Colors',
        fontSize:25
7     }
8     }
可以在options中通过改变legend属性的值来隐藏图例,代码如下:
 1 options: {
 2       responsive:true,
 3     maintainAspectRatio: false,
 4     title:{
 5       display:true,
 6       text:'My Favorite Colors',
 7       fontSize:25
 8     },
 9     legend: {
10             display: false,
11
12         }
13
14     }
在options中通过将legend属性的position值设为'right'可以让图例在右侧显示。
 1 options: {
 2       responsive:true,
 3     maintainAspectRatio: false,
 4     title:{
 5       display:true,
 6       text:'My Favorite Colors',
 7       fontSize:18
 8     },
 9     legend: {
10             display: true,
11             position:'right',
12
13         }
14
15     }
最后,本次课的完整代码如下:
 1 <html>
 2 <head>
 3
 4 <script src="https://cdnjs.cloudflare.com/ajax/libs/Chart.js/2.9.3/Chart.min.js"></script>
 5
 6 </head>
 7 <body>
 8 <div class="chart-container" style="position: relative; height:40vh; 40vw">
 9 <canvas id="myChart" ></canvas>
10 </div>
11 <script>
12 var ctx = document.getElementById('myChart').getContext('2d');
13 var myChart = new Chart(ctx, {
14     type: 'bar',
15     data: {
16         labels: ['Red', 'Blue', 'Yellow', 'Green', 'Purple', 'Orange'],
17         datasets: [{
18             label: '# of Votes',
19             data: [12, 19, 3, 5, 4, 3],
20             backgroundColor: [
21                 'rgba(255, 99, 132, 0.2)',
22                 'rgba(54, 162, 235, 0.2)',
23                 'rgba(255, 206, 86, 0.2)',
24                 'rgba(75, 192, 192, 0.2)',
25                 'rgba(153, 102, 255, 0.2)',
26                 'rgba(255, 159, 64, 0.2)'
27             ],
28             borderWidth:4,
29             borderColor:'black'
30         }]
31     },
32
33
34     options: {
35       responsive:true,
36     maintainAspectRatio: false,
37     title:{
38       display:true,
39       text:'My Favorite Colors',
40       fontSize:18
41     },
42     legend: {
43             display: true,
44             position:'right',
45
46         }
47
48     }
49 });
50 </script>
51
52 </body>
53 </html>