下载地址 https://www.ngdc.noaa.gov/mgg/global/global.html
下载的flt格式的etopo1文件转换成arcmap中的raster格式.
(应有flt格式数据文件和头文件hdr格式的文件,共2个,否则转换报错)
(1)格式转换
(a)python
import arcpy
arcpy.FloatToRaster_conversion("D:/arcgis/etopo1_ice_g_f4.flt","D:/arcgis/etopo1")
(b)或者在arcmap中
arcmap-arctoolbox-convertion tools-to raster-float to raster.
(2)投影参数设置
搜索wgs,选择wgs1984
https://blogs.esri.com/esri/arcgis/2011/09/21/using-etopo1-data/
Below, I’ve outlined the steps I used to download the data from NOAA and process it for use in ArcMap:
- Go to the ETOPO1 Web site (http://www.ngdc.noaa.gov/mgg/global/global.html).
- If you want the ice surface data, save the following file to a directory on your computer and then unzip it:
• ETOPO1 Ice Surface > grid-registered > binary > f4 format
•http://www.ngdc.noaa.gov/mgg/global/relief/ETOPO1/data/ice_surface/grid_registered/binary/etopo1_ice_g_f4.zip - If you want the bedrock data, save the following file to a directory on your computer and then unzip it:
• ETOPO1 Bedrock > grid-registered > binary > f4 format
•http://www.ngdc.noaa.gov/mgg/global/relief/ETOPO1/data/bedrock/grid_registered/binary/etopo1_bed_g_f4.zip - In ArcGIS, use the Float to Raster tool (in the Conversion Tools toolbox in the “To Raster” toolset) with the downloaded and unzipped file as the input floating point raster file. Specify the output file to be placed in a file geodatabase of your choice. This step will also convert the data to the right format to be used with a color map file (which we will discuss in a subsequent blog entry Symbolizing ETOPO1 Data).
- Use the Define Projection tool (in the Projections and Transformations toolset of the Data Management toolbox) to define the projection using a Geographic Coordinate System -> World -> WGS 1984 projection.
Here is the citation that NOAA requests you use if you have included the data on your map:
Amante, C. and B. W. Eakins, ETOPO1 1 Arc-Minute Global Relief Model: Procedures, Data Sources and Analysis. NOAA Technical Memorandum NESDIS NGDC-24, 19 pp, March 2009. Go to this web site: http://www.ngdc.noaa.gov/mgg/global/global.html.
Once you have downloaded and processed the data, you are ready to display it on a map. Look for our subsequent blog entry about Symbolizing ETOPO1 data to see how this can quickly and easily be done – with beautiful results!
颜色设置参考
https://blogs.esri.com/esri/arcgis/2012/08/02/esri-ocean-basemap-color-style-available-for-download/
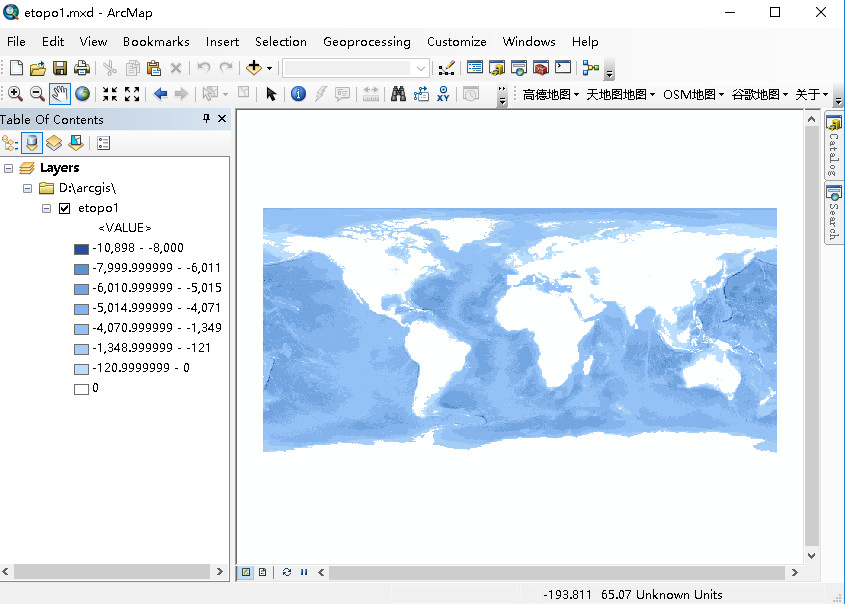
最后结果