前言
关于本篇功能实现用到的 api 涉及类看不懂的,请参照 esri 官网的 arcgis api 4.x for js:esri 官网 api,里面详细的介绍 arcgis api 4.x 各个类的介绍,还有就是在线例子:esri 官网在线例子,这个也是学习 arcgis api 4.x 的好素材。
由于 arcgis api 4.x for js 目前没有提供绘制手绘面以及手绘线, 所以本篇自定义绘制工具 Draw 来实现,效果图如下: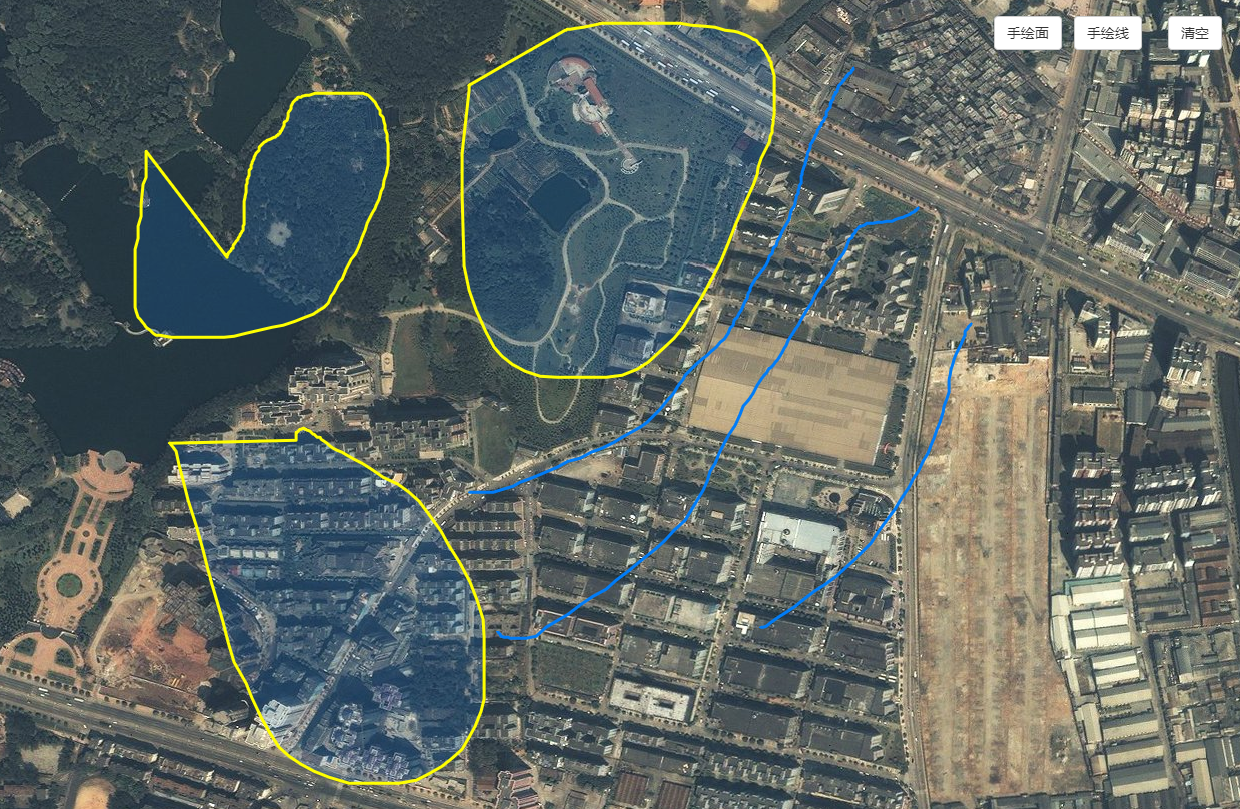
- 下载源码的 zip 解压,源码在文章尾部提供

- 拷贝 Custom.js 以及 Draw.js 两个文件放在本机离线部署的 arcgis api 指定的目录esri文件夹下面,我本机的是如下

- html 页面完整代码
<!DOCTYPE html>
<html>
<head>
<meta charset="utf-8">
<meta name="viewport" content="initial-scale=1,maximum-scale=1,user-scalable=no">
<title></title>
<style>
html,
body,
#viewDiv {
padding: 0;
margin: 0;
height: 100%;
 100%;
}
.buttonRight{
position: absolute;
z-index: 999;
}
</style>

<link rel="stylesheet" href="http://localhost/arcgis_js_api/library/4.10/esri/css/main.css">
<link rel="stylesheet" href="http://netdna.bootstrapcdn.com/bootstrap/3.1.1/css/bootstrap.min.css"/>
<script src="http://libs.baidu.com/jquery/2.1.4/jquery.min.js"></script>
<script src="http://localhost/arcgis_js_api/library/4.10/init.js"></script>

<script>
require([
"esri/Map",
"esri/views/MapView",
"esri/Basemap",
"esri/layers/TileLayer",
"esri/layers/GraphicsLayer",
"esri/symbols/SimpleFillSymbol",
"esri/custom/Draw"

], function(Map, MapView, Basemap, TileLayer, GraphicsLayer, SimpleFillSymbol, Draw) {

layer = new TileLayer({
url: "http://server.arcgisonline.com/arcgis/rest/services/ESRI_Imagery_World_2D/MapServer"
});
basemap = new Basemap({
baseLayers: [layer]
});
map = new Map({//加载arcgis在线地图
//basemap: "streets"
basemap: basemap
});
view = new MapView({//创建二维视图
container: "viewDiv",
map: map,
zoom: 15,
center: [113.3659, 23.1284] // longitude, latitude
});
//视图加载完成
view.when(function(){
//初始化自定义绘制工具
draw = new Draw(view);
});
//手绘面
$("#free_polygon").click(function(){
draw.activate("free_polygon");
});
//手绘线
$("#free_polyline").click(function(){
draw.activate("free_polyline");
});
//清空
$("#clear").click(function(){
if(draw){
draw.graphicsLayer.removeAll();;
}
});

});
</script>
</head>

<body>
<div id="viewDiv"></div>
<button id="free_polygon" class="btn btn-default buttonRight" style="top:20px;right:180px">手绘面</button>
<button id="free_polyline" class="btn btn-default buttonRight" style="top:20px;right:100px">手绘线</button>
<button id="clear" class="btn btn-default buttonRight" style="top:20px;right:20px">清空</button>
</body>
</html>
更多的详情见:GIS之家小专栏
文章尾部提供源代码下载,对本专栏感兴趣的话,可以关注一波