主要借助QCustomPlot第三方库,该库可到官网下载 http://www.qcustomplot.com/ ,具体使用如下代码:


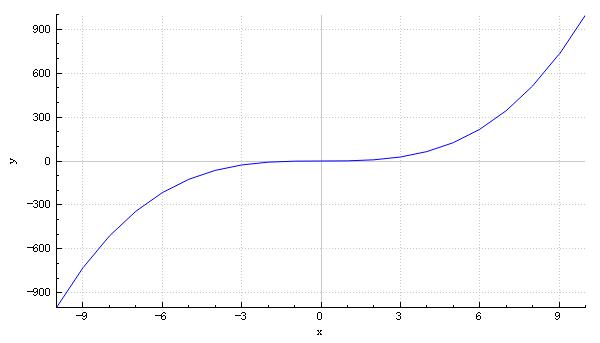
 1        plot=new QCustomPlot(this);    //QCustomPlot *plot;
 2        this->setCentralWidget(plot);
 3
 4        //向绘图区域QCustomPlot(从widget提升来的)添加一条曲线
 5     plot->addGraph();
 6
 7     //设置显示的xy显示
 8     plot->xAxis->setLabel("x");
 9     plot->yAxis->setLabel("y");
10
11     //定义两个可变数组存放绘图的坐标数据
12      QVector<double> x(101),y(101);//分别存放x和y坐标的数据,101为数据长度
13     //添加数据,我们这里演示y=x^3,为了正负对称,我们x从-10到+10
14     for(int i=0;i<101;i++)
15     {
16             x[i] = i/5 - 10;
17             y[i] = x[i] * x[i] * x[i];
18     }
19
20     //添加数据
21     plot->graph(0)->setData(x,y);
22
23     /*plot->xAxis->setRange(-11,11);
24     plot->yAxis->setRange(-1100,1100);*/
25
26     plot->rescaleAxes();    //自动设置范围
27
28     //实现放缩和平移
29     plot->setInteractions(QCP::iRangeDrag | QCP::iRangeZoom);
30
31     plot->replot();
还有更多方便炫酷的功能,如保存为图片(plot->saveJpg("D:/ss.jpg");),动态等,以后用到再继续增加。
运行效果如图:
注:
如果需要将其编译成动态库,方法是,从官网上下载QCustomPlot-sharedlib,然后拷贝qcustomplot.h和qcustomplot.cpp到与qcustomplot-sharedlib同级的目录下,
1)方法1:然进入到其子目录sharedlib-compilation,找到.pro工程文件,用QtCreator打开编译即可,会生成debug和release两个文件夹,里面有对应版本的动态库。
2)方法2:对于我这种不用QtCreator编辑器的,就要在VS中导入.pro文件(以上的相对路径要设置好),然后可以在不同的模式(debug、release)下进行编译,也可以修改生成目标文件的名字,很方便。