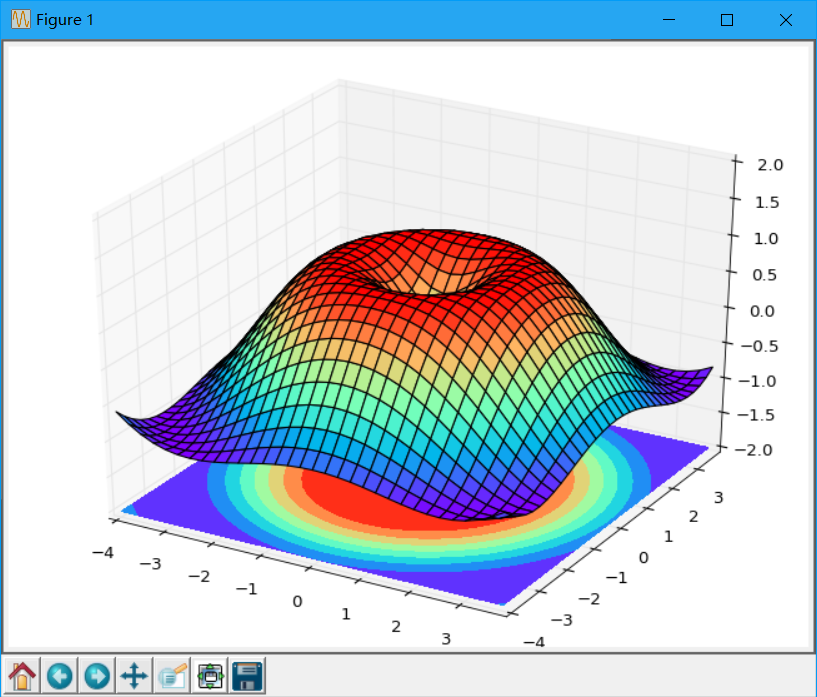
import numpy as np
import matplotlib.pyplot as plt
from mpl_toolkits.mplot3d import Axes3D

fig = plt.figure()
ax = Axes3D(fig)
#X Y value
X = np.arange(-4,4,0.25)
Y = np.arange(-4,4,0.25)
X,Y = np.meshgrid(X,Y)
R = np.sqrt(X**2 + Y**2)
#hight value
Z = np.sin(R)

ax.plot_surface(X, Y, Z, rstride=1, cstride=1, cmap=plt.get_cmap('rainbow'))
"""
============= ================================================
        Argument      Description
        ============= ================================================
        *X*, *Y*, *Z* Data values as 2D arrays
        *rstride*     Array row stride (step size), defaults to 10
        *cstride*     Array column stride (step size), defaults to 10
        *color*       Color of the surface patches
        *cmap*        A colormap for the surface patches.
        *facecolors*  Face colors for the individual patches
        *norm*        An instance of Normalize to map values to colors
        *vmin*        Minimum value to map
        *vmax*        Maximum value to map
        *shade*       Whether to shade the facecolors
        ============= ================================================
"""

# I think this is different from plt12_contours
ax.contourf(X, Y, Z, zdir='z', offset=-2, cmap=plt.get_cmap('rainbow'))
"""
==========  ================================================
        Argument    Description
        ==========  ================================================
        *X*, *Y*,   Data values as numpy.arrays
        *Z*
        *zdir*      The direction to use: x, y or z (default)
        *offset*    If specified plot a projection of the filled contour
                    on this position in plane normal to zdir
        ==========  ================================================
"""
ax.set_zlim(-2, 2)
plt.show()
=================================================================================================
import turtle
turtle.setup(650, 350, 200, 200)
turtle.penup()
turtle.fd(-250)
turtle.pendown()
turtle.pensize(25)
turtle.pencolor("blue")
turtle.seth(-40)
for i in range(4):
    turtle.circle(40, 80)
    turtle.circle(-40, 80)
turtle.circle(40, 80/2)
turtle.fd(40)
turtle.circle(16, 180)
turtle.fd(40 * 2 / 3)
turtle.done()