phpstrom 不像其他开发工具 Eclipse,visual studio 那样本身就可以断点调试,我们需要配置一些东西才能实现。在你很确定哪一步出了问题可以用输出调试,
但是在不知掉的情况下,TMD老是ECHO ,print_r,var_dump?大家都很忙的,浪费时间精力,有了xdebug,我们就可以一步一步的调试跟踪程序的运行,好处不是一星两点。
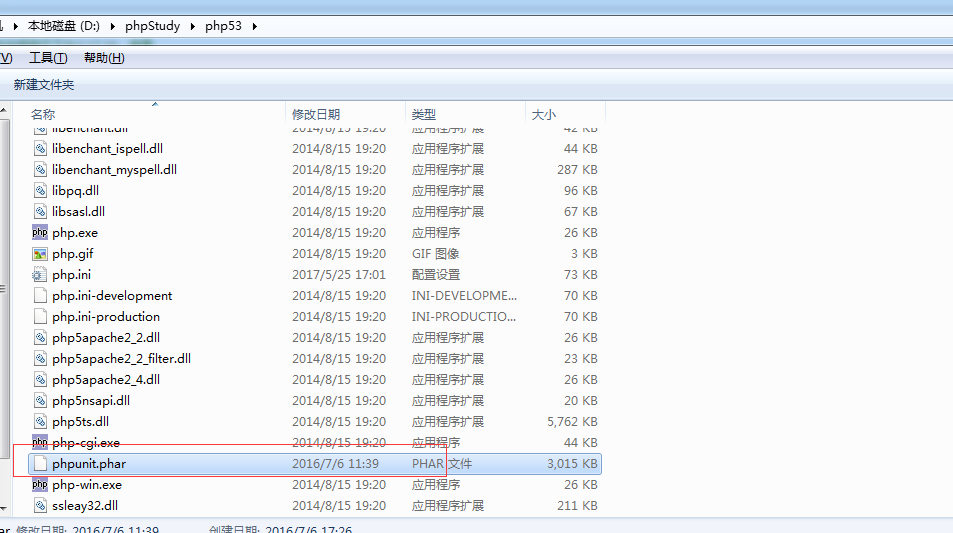
首先下载PHPunit,http://www.phpunit.cn/ 放进PHP文件夹 根据你PHP版本来放置
打开PHPstrom 文件-> 设置 ->语言和框架->php
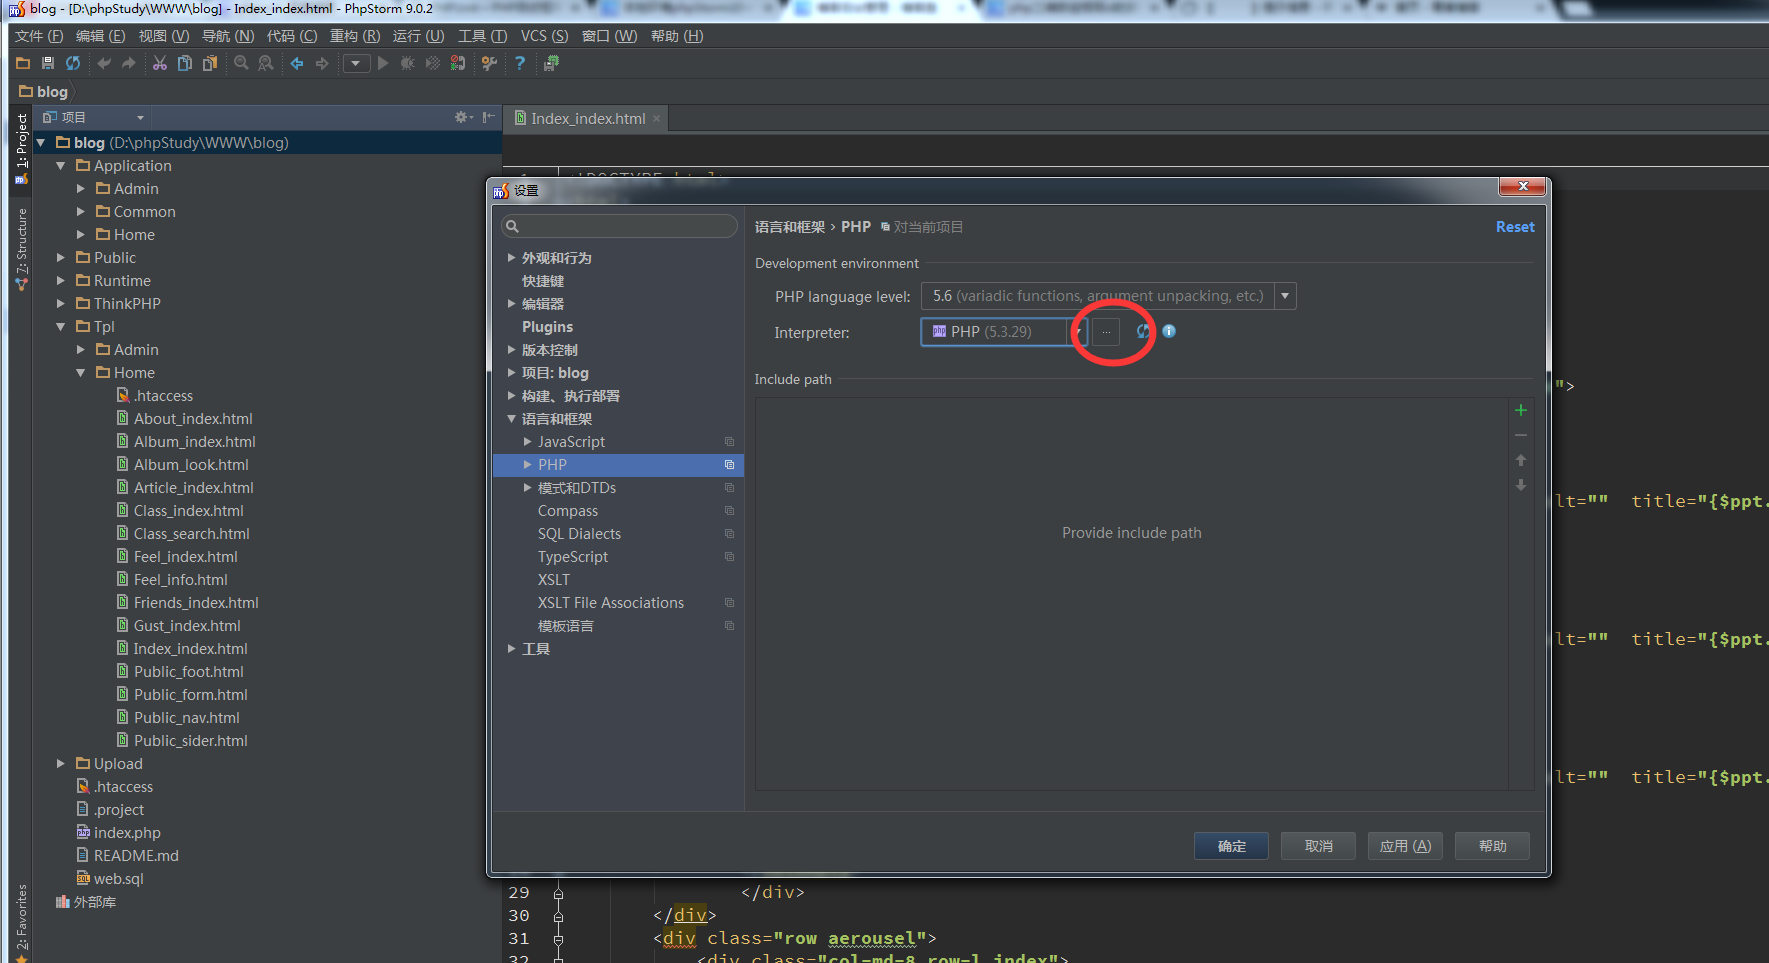
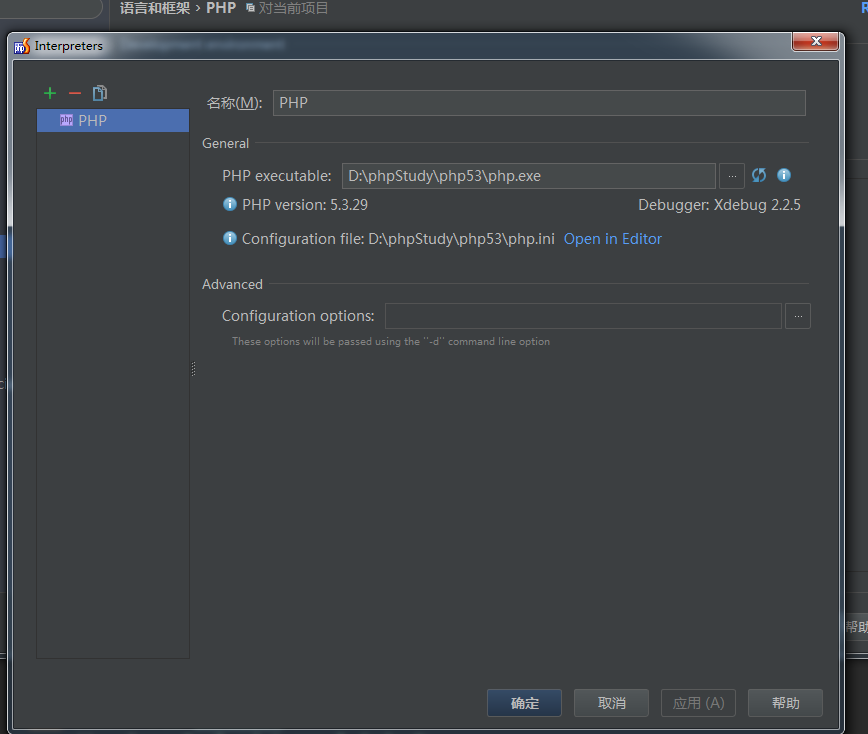
添加PHP版本
应用确定之后,再打开PHP下面的PHPUnit
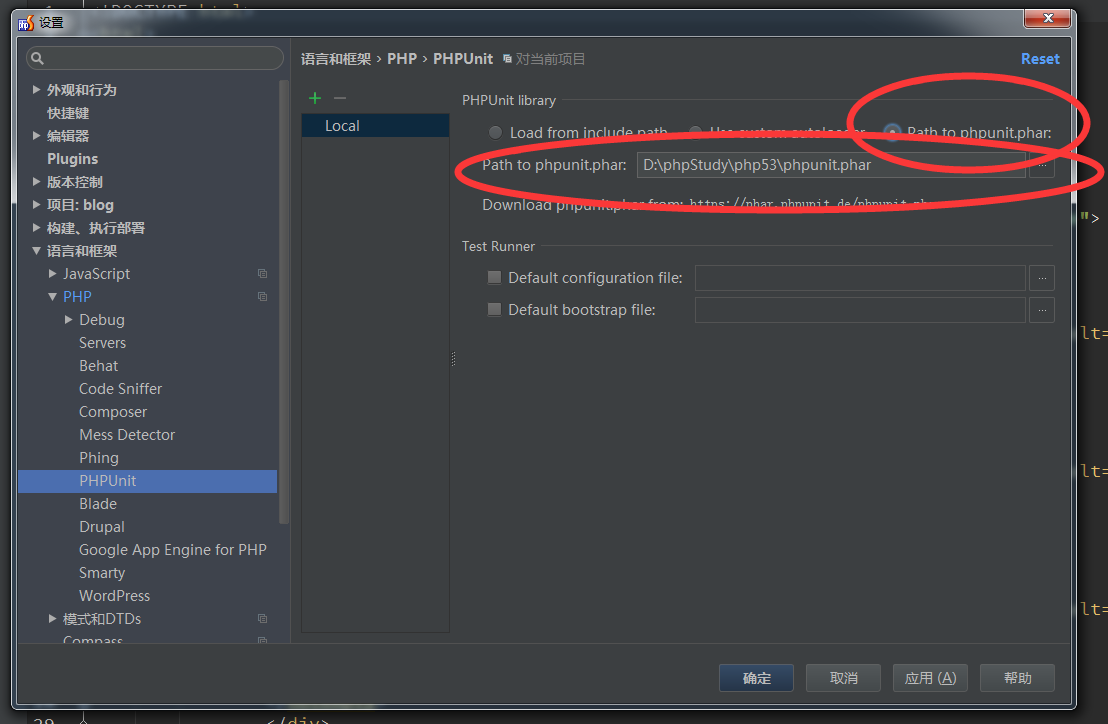
选择第三个,将你刚才放置的phpUnit添加进去,然后应用。打开上面的debug 点击第二个DBGp Proxy
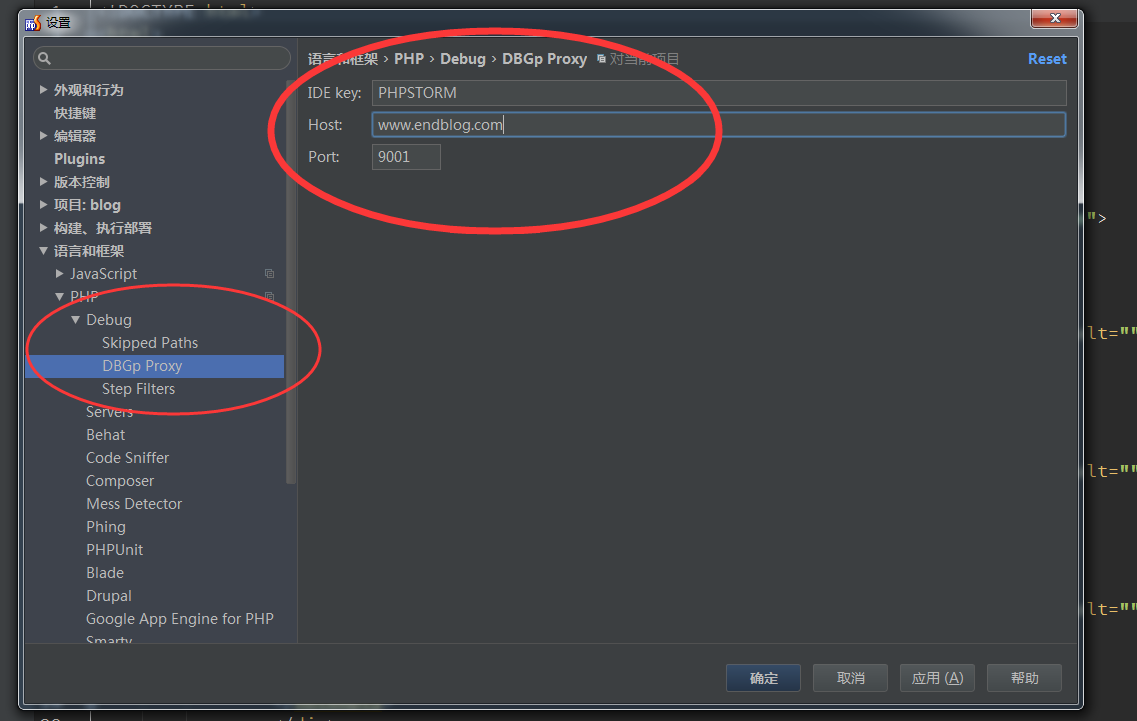
IDE Key填 PHPSTROM host就是你要调试的这个项目域名 port默认 应用确定
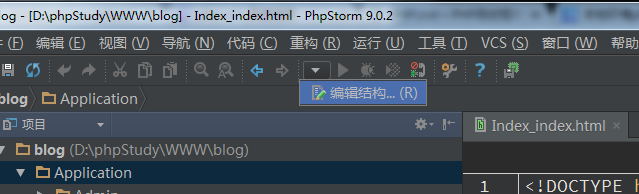
选择 调试/运行配置 编辑结构
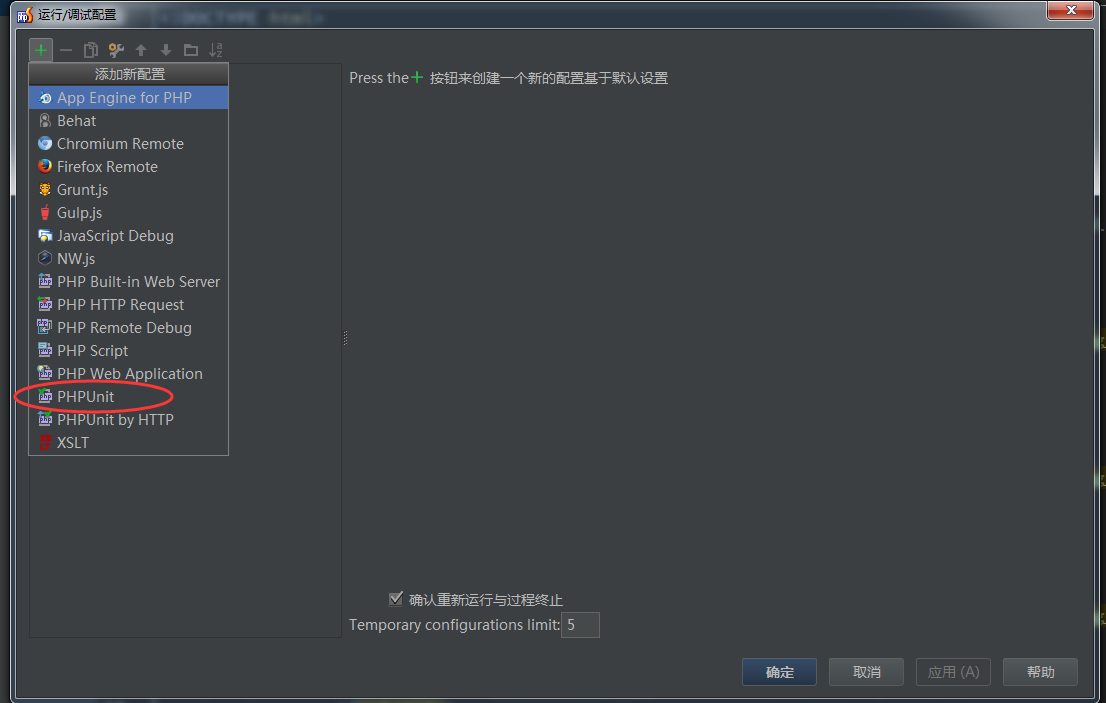
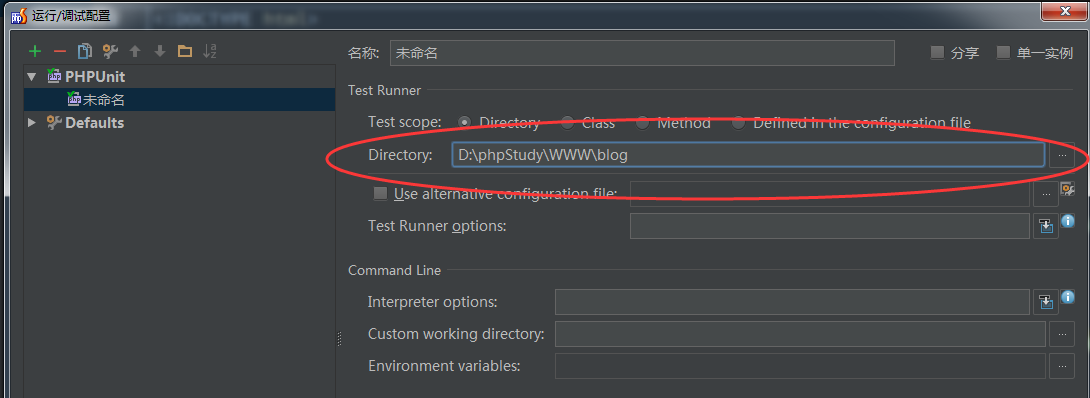
添加一个PHPUnit ,选择你项目的目录
再新建一个PHP web Application
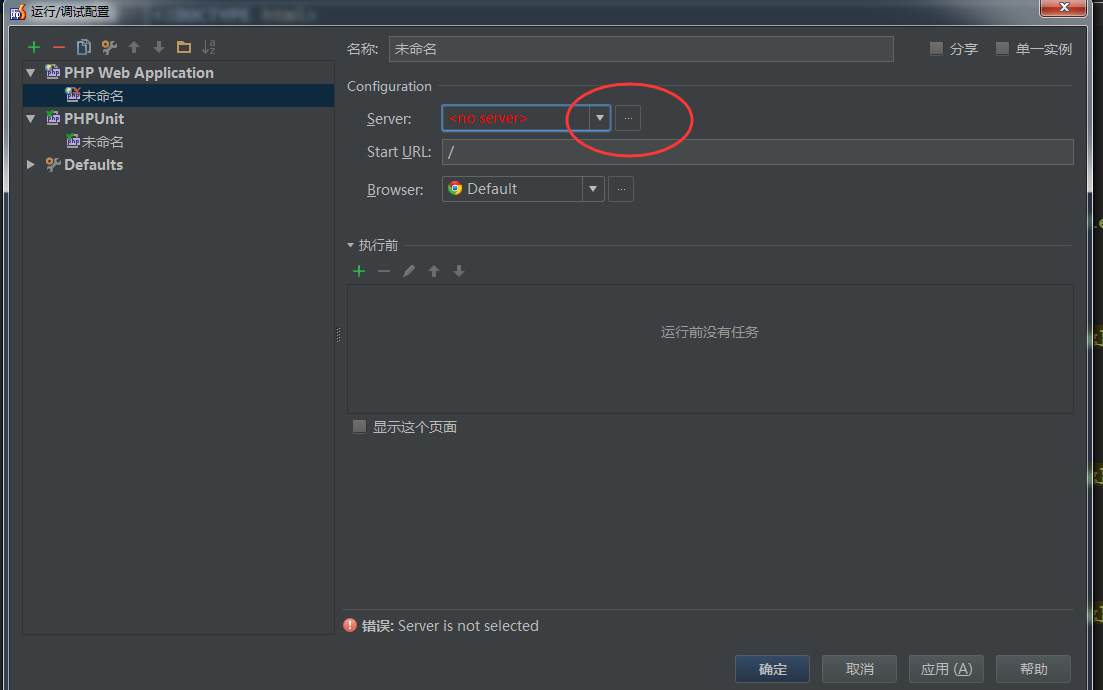
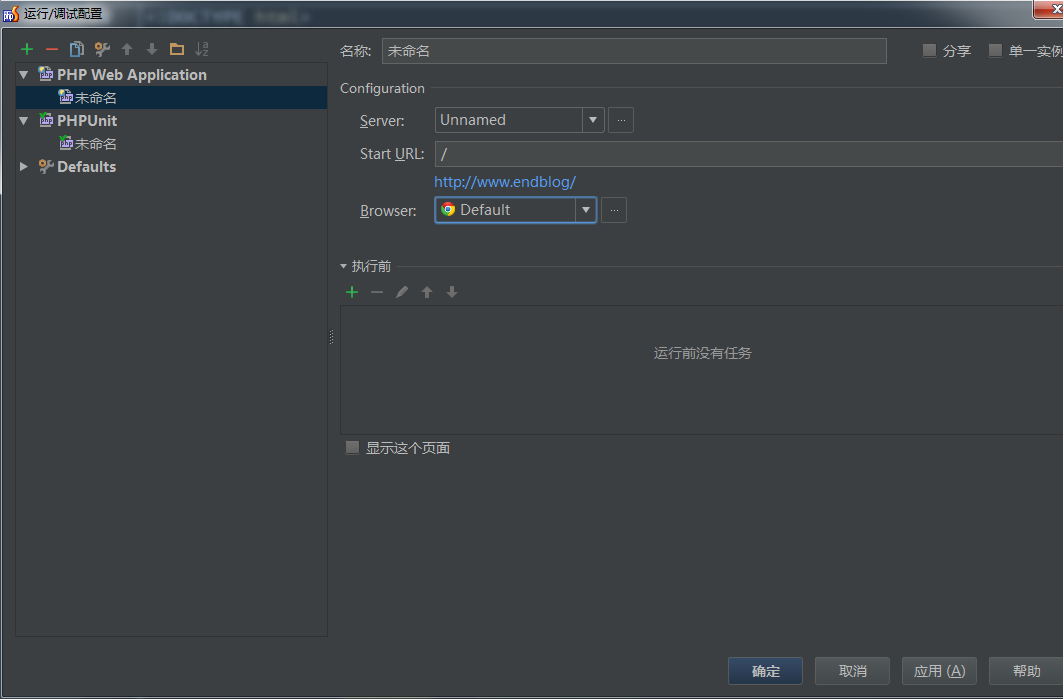
新建一个servers host 填项目域名,debugger 选择xdebug 应用确定

选择谷歌浏览器
然后打开PHP.ini 修改 [XDebug] 添加项目域名
xdebug.profiler_append = 0
xdebug.profiler_enable = 1
xdebug.profiler_enable_trigger = 0
xdebug.profiler_output_dir ="D:phpStudy mpxdebug"
xdebug.trace_output_dir ="D:phpStudy mpxdebug"
xdebug.profiler_output_name = "cache.out.%t-%s"
xdebug.remote_enable = 1
xdebug.remote_handler = "dbgp"
xdebug.remote_host = "www.endblog.com"
zend_extension="D:phpStudyphp53nextxdebug.dll"
xdebug.idekey="PHPSTORM"
重启一下phpStudy
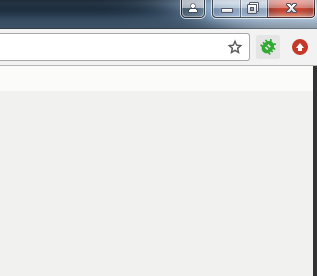
最后一步下载xdebug helper chrome 版,把它拉进谷歌浏览器 ,安装这个扩展。并且打开,还有打开PHPstrom那个电话。
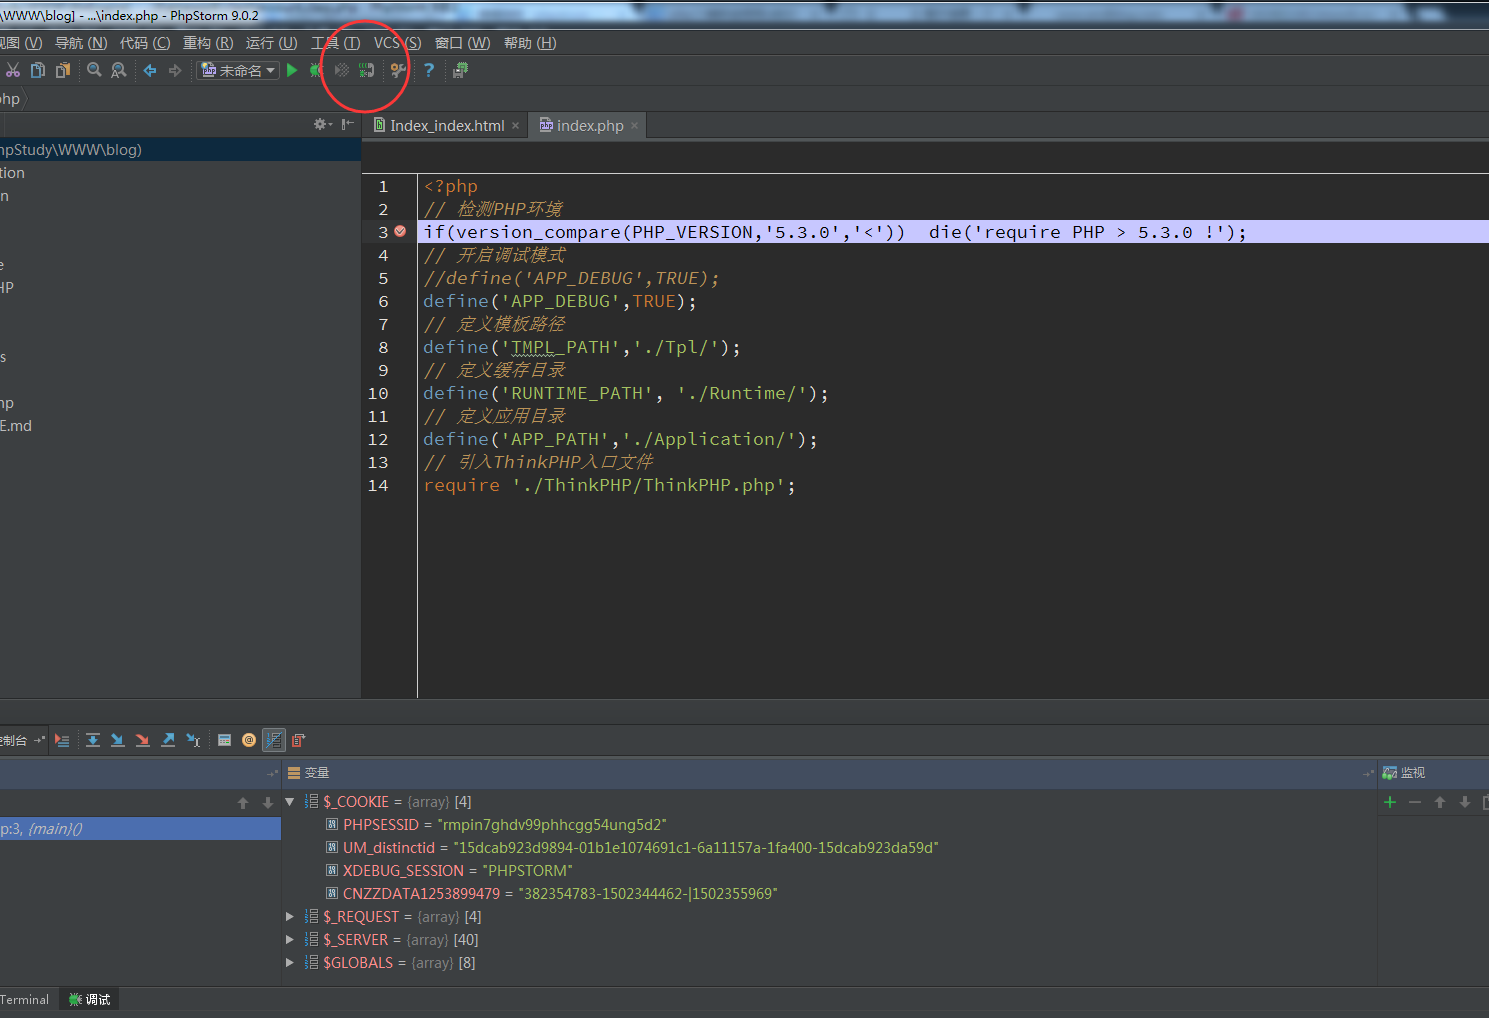
浏览器刷新,OK,这样我们就可以进行断点调试了