highchart
#下载
https://www.highcharts.com/download
a. 简单例子
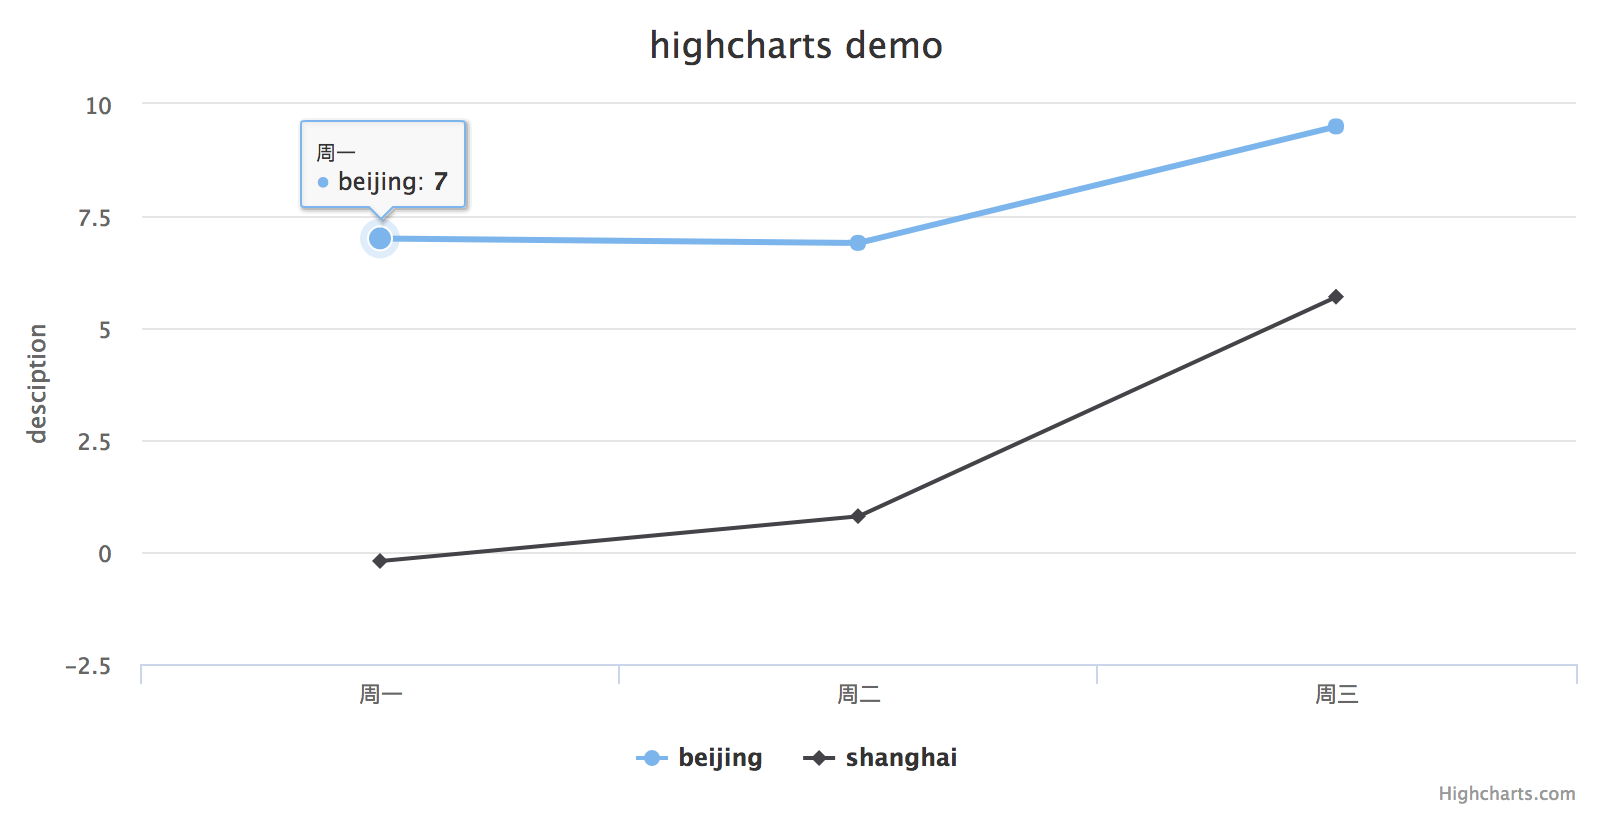


<!DOCTYPE html>
<html lang="en">
<head>
    <meta charset="UTF-8">
    <title>Title</title>

</head>
<body>

    <div id="container" style=" 800px;height: 400px">

    </div>
    <script src="/static/jquery-3.2.1.js"></script>
    <script src="/static/Highcharts-5.0.12/code/highcharts.js"></script>
    <script >
        Highcharts.setOptions({
            global: {
                useUTC: false
            }
        });
        var chart = new Highcharts.Chart('container',{
            title:{
                text:"highcharts demo",
            },
            xAxis:{
                categories:["周一","周二","周三"]
            },
            yAxis:{
                title:{
                    text:"desciption"
                }
            },
            series:[{
                name:"beijing",
                data:[7.0,6.9,9.5]
            },{
                name:"shanghai",
                data:[-0.2,0.8,5.7]
            }]
        });

    </script>

</body>
</html>
b. 改变提示框属性,新增一条线,原来线动态增加点(x轴固定)
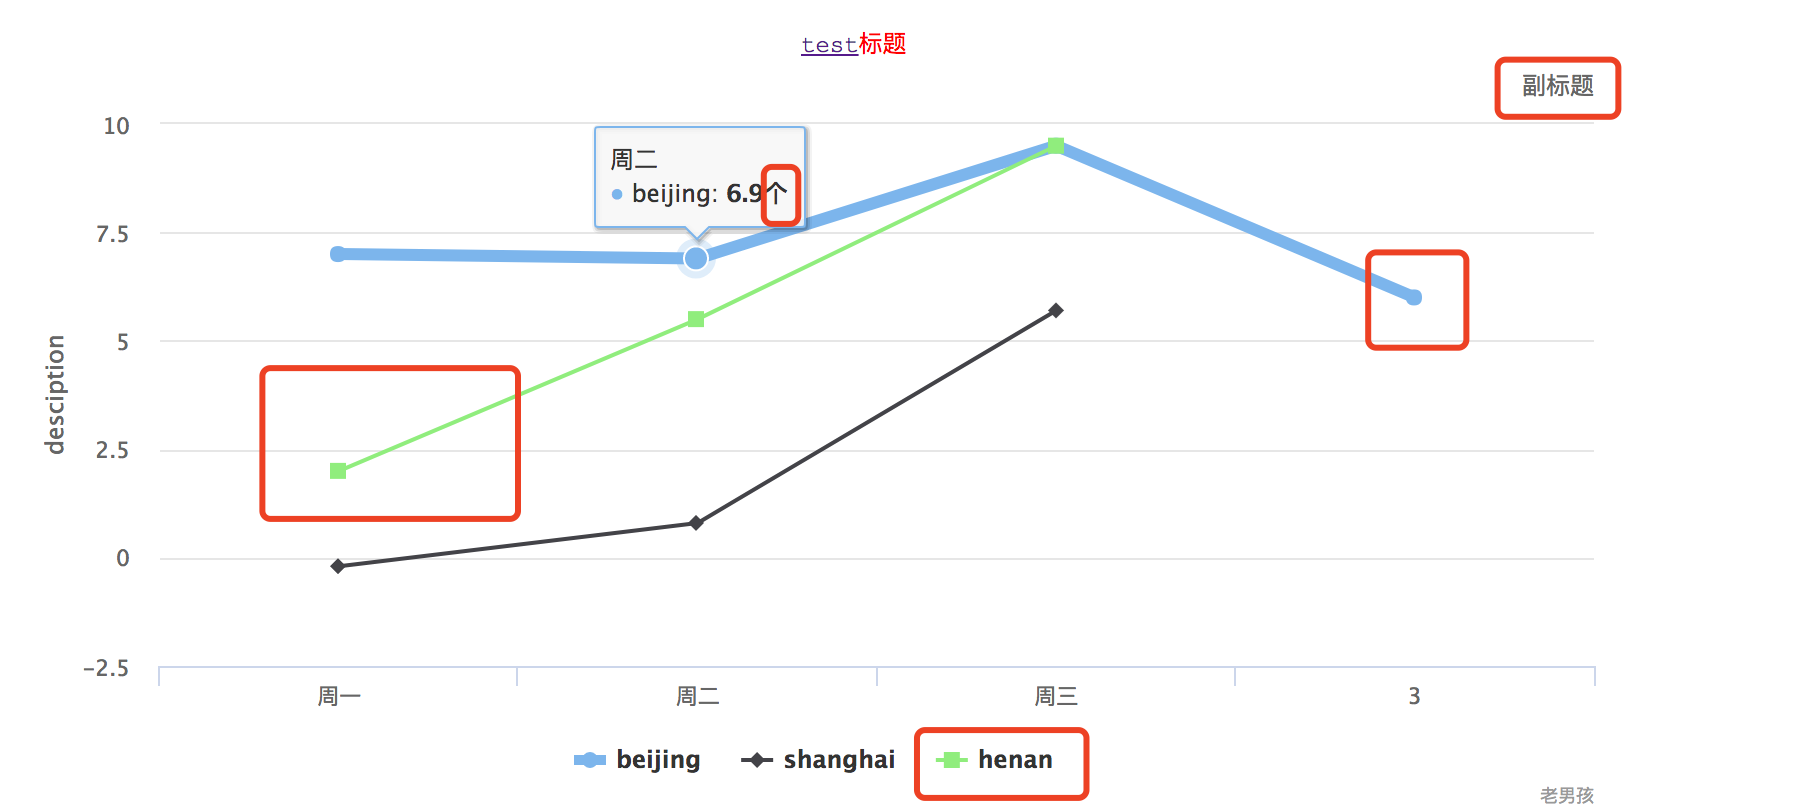
<!DOCTYPE html>
<html lang="en">
<head>
    <meta charset="UTF-8">
    <title>Title</title>

</head>
<body>

    <div id="container" style=" 800px;height: 400px">

    </div>
    <script src="/static/jquery-3.2.1.js"></script>
    <script src="/static/Highcharts-5.0.12/code/highcharts.js"></script>
    <script >
        Highcharts.setOptions({
            global: {
                useUTC: false
            }
        });
        var chart = new Highcharts.Chart('container',{
            title: {
                text: "<a href='http://www.baidu.com'>test</a>标题",
                useHTML: true,
                x:20,          //移动的位置
                style: {                         //设置字体样式
                    color: '#ff0000',
                    fontSize: '12px',
                    fontWeight: 'blod',
                    fontFamily: "Courier new"
                }
            },
            subtitle:{
                text:"副标题",
                align:"right",   //位置
            },
            chart: {
                events: {
                    load: function (e) {
                        // 图标加载时,执行的函数or去后台取数据
                    }
                }
            },
            credits: {          //右下角广告
                enable: true,
                position: {
                    align: 'right',
                    verticalAlign: 'bottom'
                },
                text: '老男孩',
                href: 'http://www.oldboyedu.com'
            },
//            tooltip: {                    //Tooltip用于设置当鼠标滑向数据点时显示的提示框信息
//                    backgroundColor: '#FCFFC5', //背景颜色
//                    borderColor: 'red',  //边框颜色
//                    borderRadius: 10,    //边框圆角
//                    borderWidth:3,
//                    shadow: true,         //是否显示阴影
//                    animation: true,      //是否启用动画效果
//                    style: {
//                        color: 'ff0000',
//                        fontSize: '12px',
//                        fontWeight: 'blod',
//                       fontFamily: "Courier new"
//                    }
//            },
            tooltip: {              //源码自定义
                pointFormatter: function (e) {
                    var tpl = '<span style="color:' + this.series.color + '">●</span> ' + this.series.name + ': <b>' + this.y + '个</b><br/>';
                    return tpl;
                },
                useHTML: true
            },
            plotOptions: {      //点击触发的事件
                series: {
                    cursor: 'pointer',
                    events: {
                        click: function (event) {
                            // 点击某个指定点时,执行的事件
                            console.log(this.name, event.point.x, event.point.y);
                        }
                    }
                }
            },

            xAxis:{
                categories:["周一","周二","周三"]
            },
            yAxis:{
                title:{
                    text:"desciption"
                }
            },
            series:[{
                name:"beijing",
                data:[7.0,6.9,9.5],
                lineWidth:5    //加粗
            },{
                name:"shanghai",
                data:[-0.2,0.8,5.7]
            }]
        });

    // chart.addSeries({name:'henan',data: [2.0,5.5,9.5]});    //新增加一条线,不常用
    // 参数:数值;是否重绘; isShift; 是否动画
    // chart.series[0].addPoint(6);                            //其中一条线延长


    </script>

</body>
</html>
c. 动态增加值
console里增加 chart.series[0].addPoint([1501689835377.358, 15.9])
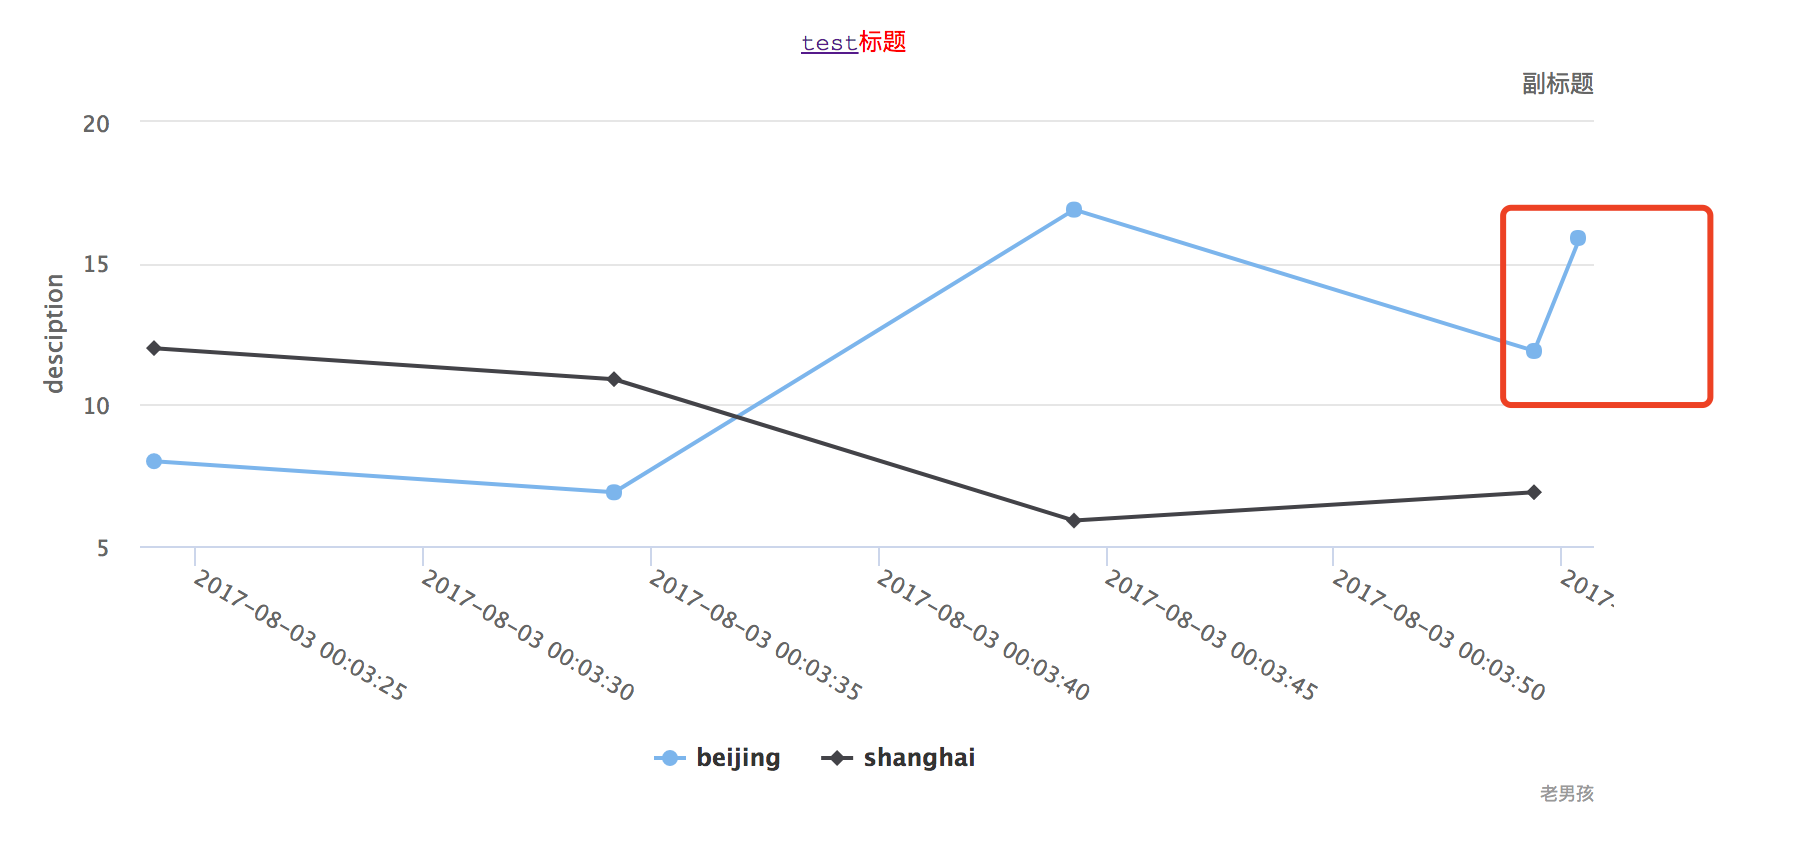
<!DOCTYPE html>
<html lang="en">
<head>
    <meta charset="UTF-8">
    <title>Title</title>

</head>
<body>

    <div id="container" style=" 800px;height: 400px">

    </div>
    <script src="/static/jquery-3.2.1.js"></script>
    <script src="/static/Highcharts-5.0.12/code/highcharts.js"></script>
    <script >
        Highcharts.setOptions({
            global: {
                useUTC: false
            }
        });
        var chart = new Highcharts.Chart('container',{
            title: {
                text: "<a href='http://www.baidu.com'>test</a>标题",
                useHTML: true,
                x:20,          //移动的位置
                style: {                         //设置字体样式
                    color: '#ff0000',
                    fontSize: '12px',
                    fontWeight: 'blod',
                    fontFamily: "Courier new"
                }
            },
            subtitle:{
                text:"副标题",
                align:"right",   //位置
            },
            chart: {
                events: {
                    load: function (e) {
                        // 图标加载时,执行的函数or去后台取数据
                    }
                }
            },
            credits: {          //右下角广告
                enable: true,
                position: {
                    align: 'right',
                    verticalAlign: 'bottom'
                },
                text: '老男孩',
                href: 'http://www.oldboyedu.com'
            },
//            tooltip: {                    //Tooltip用于设置当鼠标滑向数据点时显示的提示框信息
//                    backgroundColor: '#FCFFC5', //背景颜色
//                    borderColor: 'red',  //边框颜色
//                    borderRadius: 10,    //边框圆角
//                    borderWidth:3,
//                    shadow: true,         //是否显示阴影
//                    animation: true,      //是否启用动画效果
//                    style: {
//                        color: 'ff0000',
//                        fontSize: '12px',
//                        fontWeight: 'blod',
//                       fontFamily: "Courier new"
//                    }
//            },
            tooltip: {              //源码自定义
                pointFormatter: function (e) {
                    var tpl = '<span style="color:' + this.series.color + '">●</span> ' + this.series.name + ': <b>' + this.y + '个</b><br/>';
                    return tpl;
                },
                useHTML: true
            },
            plotOptions: {      //点击触发的事件
                series: {
                    cursor: 'pointer',
                    events: {
                        click: function (event) {
                            // 点击某个指定点时,执行的事件
                            console.log(this.name, event.point.x, event.point.y);
                        }
                    }
                }
            },

            xAxis:{
                type: 'datetime',
                    labels: {
                        formatter: function () {
                            return Highcharts.dateFormat('%Y-%m-%d %H:%M:%S', this.value);
                        },
                        rotation: 30
                    }
            },
            yAxis:{
                title:{
                    text:"desciption"
                }
            },
            series:[{
                name:"beijing",
                data:[7.0,6.9,9.5],
                data: [
                [1501689804077.358, 8.0],
                [1501689814177.358, 6.9],
                [1501689824277.358, 16.9],
                [1501689834377.358, 11.9]
                ]
            },{
                name:"shanghai",
                data: [
                [1501689804077.358, 12.0],
                [1501689814177.358, 10.9],
                [1501689824277.358, 5.9],
                [1501689834377.358, 6.9]
                ]
            }]
        });

    // chart.addSeries({name:'henan',data: [2.0,5.5,9.5]});    //新增加一条线,不常用
    // 参数:数值;是否重绘; isShift; 是否动画
    // chart.series[0].addPoint(6);                            //其中一条线延长


    </script>

</body>
</html>