 1 # 随机漫步类
 2 from random import choice
 3 from matplotlib import pyplot as plt
 4 from pylab import mpl
 5 from matplotlib import rcParams
 6
 7
 8 class RandomWalk():
 9     '''生成随机漫步的类'''
10
11     def __init__(self, total_num=15000):
12         self.total_num = total_num
13         '''初始坐标(0,0)'''
14         self.x_values = [0]
15         self.y_values = [0]
16
17     def get_step(self):
18         '''随机生成移动的方向和距离'''
19         diretion = choice([1, -1])
20         distance = choice([0, 1, 2, 3, 4, 5])
21         return diretion * distance
22
23     def fill_walk(self):
24         '''计算随机漫步中所有的点'''
25         while len(self.x_values) < self.total_num:
26             '''计算前进方向和距离'''
27             x_step = self.get_step()
28             y_step = self.get_step()
29
30
31             '''拒绝原地踏步'''
32             if x_step == 0 and y_step == 0:
33                 continue
34
35             '''计算下一个点的x和y的值'''
36             next_x = self.x_values[-1] + x_step
37             next_y = self.y_values[-1] + y_step
38
39             self.x_values.append(next_x)
40             self.y_values.append(next_y)
41
42
43 # 设置默认字体,解决中文显示乱码问题
44 mpl.rcParams['font.sans-serif'] = ['SimHei']
45 # 解决负号'-'显示为方块的问题
46 rcParams['axes.unicode_minus'] = False
47
48 # 随机漫步实例
49 rw = RandomWalk()
50 rw.fill_walk()
51 point_nunbers = list(range(rw.total_num))
52
53 # 调整绘图窗口尺寸,单位为英寸
54 plt.figure(figsize=(8, 6))
55
56 # 给点着色显示
57 plt.scatter(rw.x_values, rw.y_values, c=point_nunbers, cmap=plt.cm.Blues, s=1)
58 plt.title("随机漫步图", fontsize=18)
59
60 # 突出起点和终点
61 plt.scatter(0, 0, c='green', s=30)
62 plt.scatter(rw.x_values[-1], rw.y_values[-1], c='red', s=20)
63
64 # 隐藏坐标轴
65 # plt.axes().get_xaxis().set_visible(False)
66 # plt.axes().get_yaxis().set_visible(False)
67
68 plt.show()
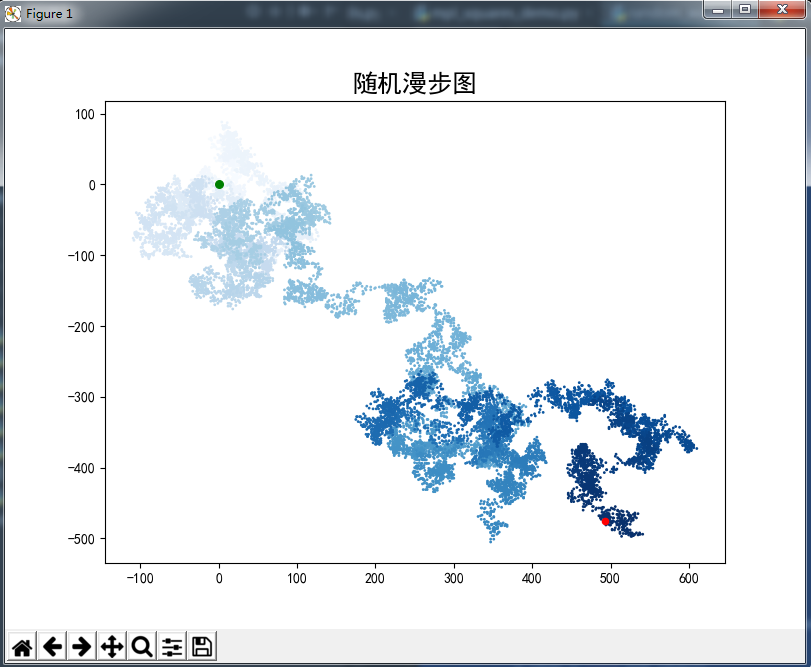
运行截图:
