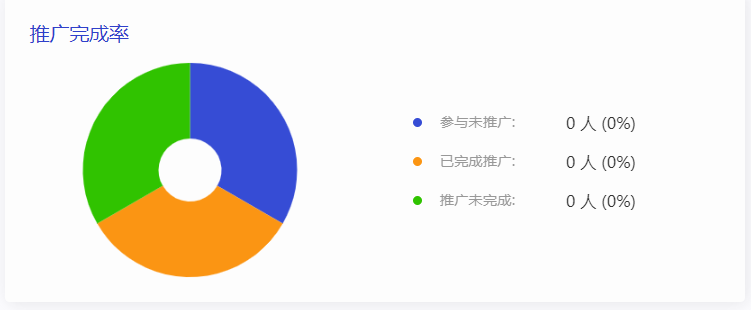
代码:
<template>
  <div class="echart-left-content">
    <div class="echart-head">
      <div class="echart-head-title">
        推广完成率
      </div>
    </div>
    <a-row class="left-row">
      <a-col :span="12">
        <div id="chart_head2" style="height:280px;100%;margin:auto;">
        </div>
      </a-col>
      <a-col :span="12" class="left-data">
        <div style=" 100%">
          <div v-for="(item, index) in leftData" :key="index" class="left-row-flex">
            <div style=" 120px;margin-right: 50px">
              <i class="income-i-left" :style="{background:item.color}"></i><span class="left-data-span ml15"> {{ item.name }} </span>
            </div>
            <div class="left-row-flex-right">
              <span>{{ item.money }} 人   </span>
              <span>
                ({{ (getRate(item.money, data.total )) }}<span>%</span>)
              </span>
            </div>
          </div>
        </div>
      </a-col>
    </a-row>
  </div>
</template>
<script>
  import echarts from '@/utils/echarts'
  import formatMoney from '@/filter/formatMoney'
  export default {
    props : {
      data : {
        type: Object,
        required: true
      },
    },
    data() {
      return {
        barData:[],
        m2R2Data: [],
        xData:[],
        rateData:[],
        leftData: [
        ]
      }
    },
    watch: {
    },
    created () {
    },
    mounted () {
      if (this.data) {
        // 调用绘制图表的方法
        this.getLeftData()
      }
    },
    methods: {
      getRate (inData, total) {
        return (inData ===0 || total ===0) ? 0 : ((inData/total) *100).toFixed(2)
      },
      getLeftData () {
        let chart = echarts.init(document.getElementById('chart_head2'))
        // 初始化图表
        this.initLeft(chart)
        this.m2R2Data= [
          {value:this.data.notPopularize, legendname:'参与未推广', itemStyle:{color:"#364CD5"}},
          {value:this.data.finish, legendname:'已完成推广', itemStyle:{color:"#FB9513"}},
          {value:this.data.popularize, legendname:'推广未完成', itemStyle:{color:"#30C300"}},
        ]
        this.leftData =  [
          { name: '参与未推广: ', color: '#364CD5', money: formatMoney(this.data.notPopularize) },
          { name: '已完成推广: ', color: '#FB9513', money: formatMoney(this.data.finish) },
          { name: '推广未完成: ', color: '#30C300', money: formatMoney(this.data.popularize) },
        ]
        chart.setOption({ //加载数据图表
          series : [
            {
              // 根据名字对应到相应的系列
              data : this.m2R2Data
            }
          ]
        })
        window.onresize = function () {
          chart.resize()
        }
      },
      initLeft (chart) {
        let option = {
          backgroundColor: '#FDFDFD',
          tooltip: {
            trigger: 'item',
            formatter:function (parms){
              let str=
                parms.marker+""+parms.data.legendname+"</br>"+
                "数量:"+ parms.data.value+"</br>"
              return  str
            }
          },
          series: [
            {
              // name:'',
              type:'pie',
              center: ['50%', '50%'],
              radius: ['25%', '85%'],
              clockwise: true, //饼图的扇区是否是顺时针排布
              avoidLabelOverlap: false,
              labelLine: {
                normal: {
                  length:0,
                  length2:0,
                  smooth:true,
                }
              },
              itemStyle:{
                borderWidth:0, //设置border的宽度有多大
              },
              data:this.m2R2Data
            }
          ]
        }
        chart.setOption(option)
      }
    }
  }
</script>

<style scoped>
  .head_img  /deep/ .el-input__inner {
    color: #C6D0FA;
    border: 1px solid #67e2eb;
  }
  .echart-head {
    padding: 35px 27px 0 27px;
    display: flex;
    justify-content: space-between;
    align-items: center;
  }
  .income-i-left {
    10px;
    height:10px;
    background:rgba(217,238,236,1);
    display: inline-block;
    border-radius: 50%;
  }
  .left-data {
    display: flex;
    align-items: center;
    justify-content: center;
    padding-left: 42px;
  }
  .left-row {
    display: flex;
    justify-content: center;
  }
  .flex-title {
    display: flex;
    justify-content: space-between;
    align-content: center;
  }
  .income-flex {
    display: flex;
  }
  .left-data-span {
     96px;
    height: 22px;
    font-size: 16px;
    font-family: PingFangSC, PingFangSC-Medium;
    font-weight: 500;
    text-align: left;
    color: #989898;
    line-height: 22px;
  }
  .left-row-flex {
    display: flex;
    flex-direction: row;
    margin-bottom: 18px;
  }
  .left-row-flex-right {
    height: 25px;
    font-size: 18px;
    font-family: PingFangSC, PingFangSC-Medium;
    font-weight: 500;
    text-align: left;
    color: #333333;
    line-height: 25px;
  }
  .echart-left {
    height: 345px;
    background: #fdfdfd;
    border-radius: 5px;
    box-shadow: 2px 2px 20px 0px rgba(47,47,47,0.11);
  }
  .echart-head-title {
     115px;
    height: 24px;
    font-size: 22px;
    font-family: PingFangSC, PingFangSC-Medium;
    font-weight: 500;
    text-align: left;
    color: #2f40cb;
    line-height: 24px;
  }
</style>