zabbix 支持的主要监控方式
(1)agent代理程序
在Agent监控方式下,zabbix-agent会主动收集本机的监控信息并通过TCP协议与zabbix-server传递信息。Agent
监控方式分为主动和被动模式。在被动模式下,zabbix-agent监听10050端口,等待zabbix-server的监控信息收集
信息请求;在主动模式下,zabbix-agent收集监控信息并通过10050端口主动将数据传给zabbix-server所在服务器
的10051端口
(2)SNMP
SNMP全称Simple Network Management Protocol,即网络管理协议,包括进程管理和被管理设备两部分。
作为一种国际通用的网络管理协议被广泛的应用于各种交换机,路由器等网络设备的管理上,而现在也越来
越多被用于对服务器的监控上
(3)JMX
JMX,全称Java Management Extensions,即Java管理拓展,是Java平台为应用程序,设备,系统等植入管
理功能的框架。在zabbix中,JMX数据的获取由zabbix-java-gateway代理程序来负责数据的采集。
(4)IPMI
IPMI,全称Interlligent Platform Management Interface,即智能平台管理接口,原本是Intel架构中
企业系统的周边设备所采用的一种工业标准,以后成为业界通用的标准。用户可以利用IPMI监控
服务器的物理特性,如包括采集CPU温度、风扇转速、主板温度,以及远程开关机等指标
(5)Trapper
Trapper监控方式使用zabbix-sender程序主动向zabbix-server发送数据。key的名称和发送的数据内容
都可以灵活定义。发送的信息采用JSON格式,遵循zabbix-sender协议。可以自定义脚本利用zabbix-sender
协议来zabbix-server发送信息。
1.实现nginx监控
base2 172.25.78.12 zabbix-server
base3 172.25.78.13 zabbix-agent,nginx
开启服务
# 在服务端
[root@base2 ~]# systemctl start zabbix-server
[root@base2 ~]# systemctl start zabbix-agent
[root@base2 ~]# systemctl start httpd
[root@base2 ~]# systemctl start mariadb
# 在客户端
[root@base3 ~]# systemctl start zabbix-agent
# 在nginx客户端
[root@base3 ~]# ls
nginx-1.15.8.tar.gz
[root@base3 ~]# tar zxf nginx-1.15.8.tar.gz
[root@base3 ~]# cd nginx-1.15.8
[root@base3 nginx-1.15.8]# vim auto/cc/gcc
171 # debug
172 #CFLAGS="$CFLAGS -g"
[root@base3 nginx-1.15.8]# yum install -y gcc make pcre-devel zlib-devel
[root@base3 nginx-1.15.8]# ./configure --prefix=/usr/local/nginx --with-http_stub_status_module
[root@base3 nginx-1.15.8]# make && make install
[root@base3 nginx-1.15.8]# cd /usr/local/nginx/conf/
[root@base3 conf]# vim nginx.conf # 因为zabbix没有针对nginx的模块,需要自己写脚本添加
location / status {
stub_status on;
access_log off;
allow 127.0.0.1;
deny all;
}
[root@base3 conf]# /usr/local/nginx/sbin/nginx -t # 检测语法
nginx: the configuration file /usr/local/nginx/conf/nginx.conf syntax is ok
nginx: configuration file /usr/local/nginx/conf/nginx.conf test is successful
[root@base3 conf]# /usr/local/nginx/sbin/nginx # 开启nginx
[root@base3 conf]# curl http://127.0.0.1/status # 测试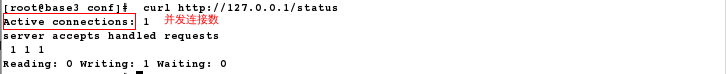
[root@base3 conf]# curl -s http://127.0.0.1/status | grep Active | awk '{print $3}' # 截取并发连接数
1
[root@base3 conf]# cd /etc/zabbix/
[root@base3 zabbix]# ls
zabbix_agentd.conf zabbix_agentd.d
[root@base3 zabbix]# cd zabbix_agentd.d/
[root@base3 zabbix_agentd.d]# ls
userparameter_mysql.conf
[root@base3 zabbix_agentd.d]# cp userparameter_mysql.conf userparameter_nginx.conf
[root@base3 zabbix_agentd.d]# vim userparameter_nginx.conf
UserParameter=nginx.active,curl -s http://127.0.0.1/status | grep Active | awk '{print $3}'
[root@base3 zabbix_agentd.d]# systemctl restart zabbix-agent
# 在服务端
[root@base2 ~]# ls
zabbix-get-4.0.5-1.el7.x86_64.rpm
[root@base2 ~]# yum install -y zabbix-get-4.0.5-1.el7.x86_64.rpm # 安装测试包,用来获取nginx的键值
[root@base2 ~]# zabbix_get -s 172.25.78.13 -p 10050 -k "nginx.active" # 获取成功
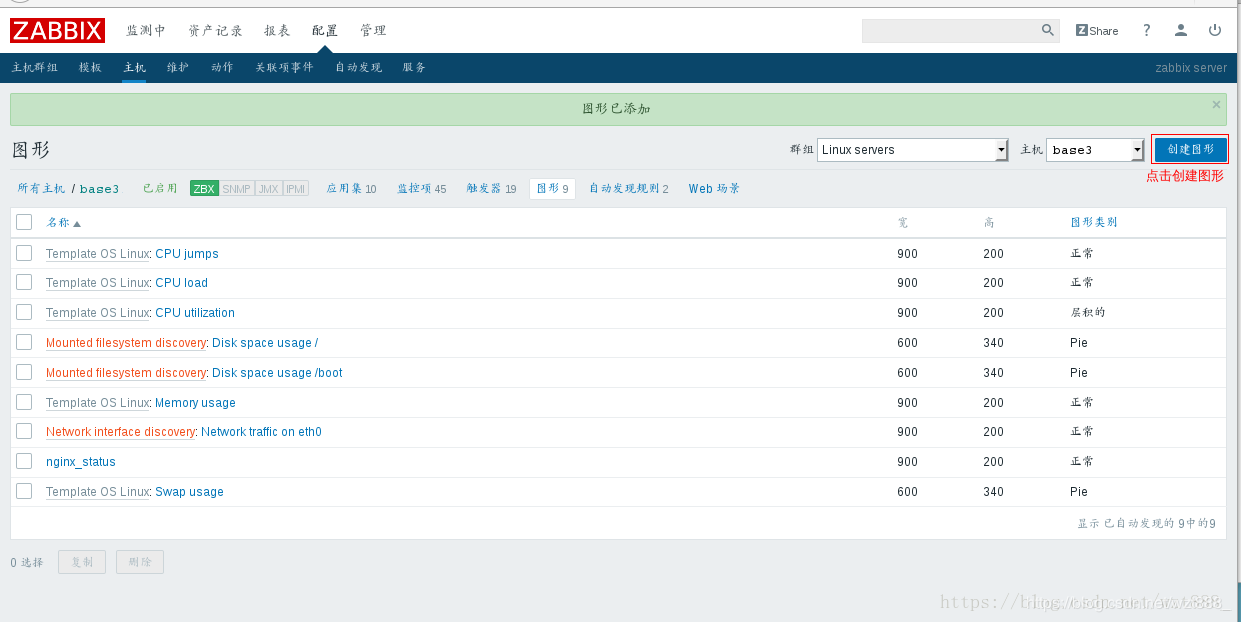
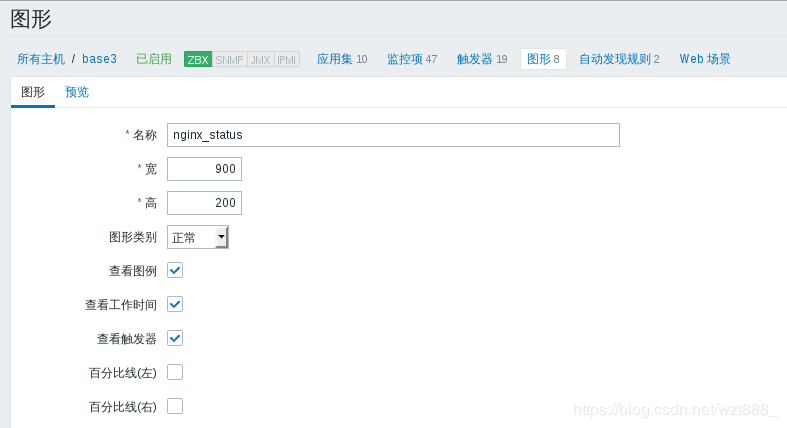
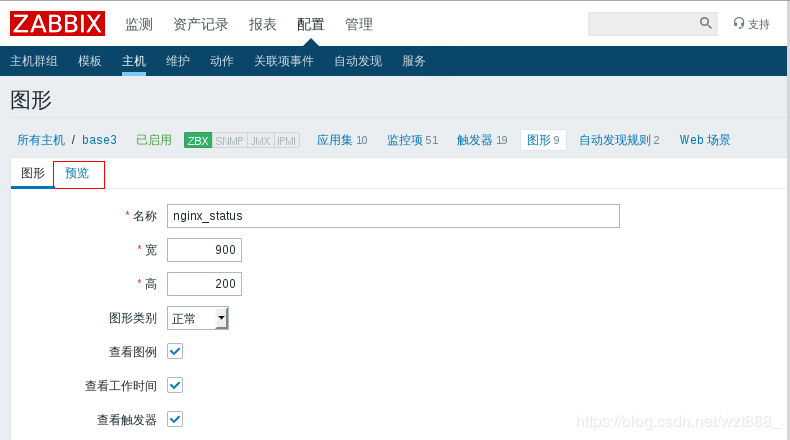
# 浏览器

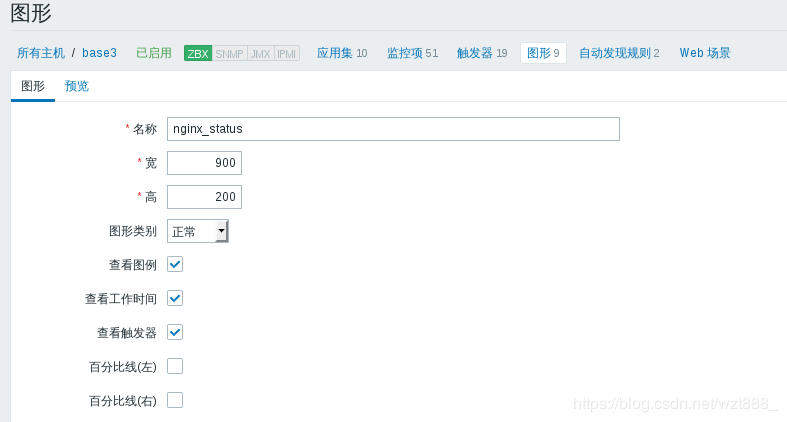
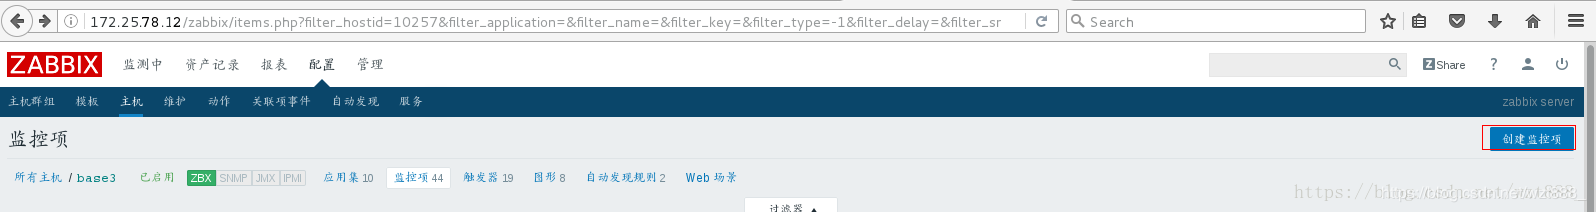 # 填写自定义名称,键值是base3上文件userparameter_nginx.conf 中的名字


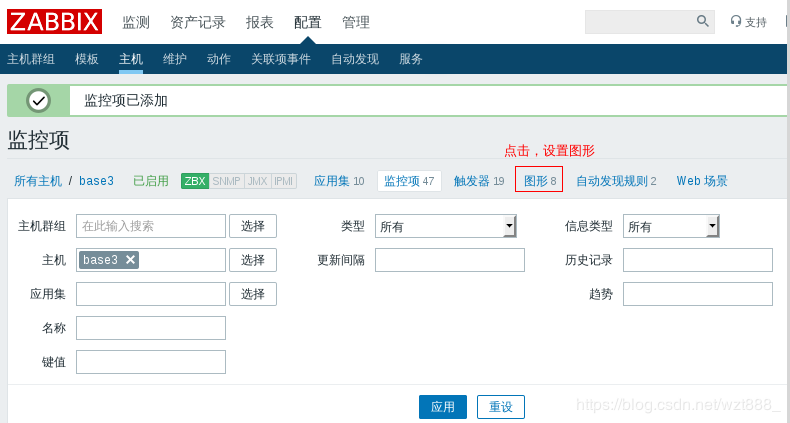


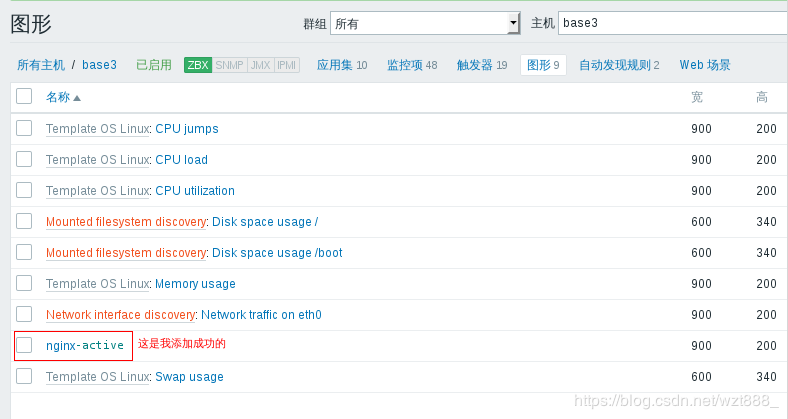
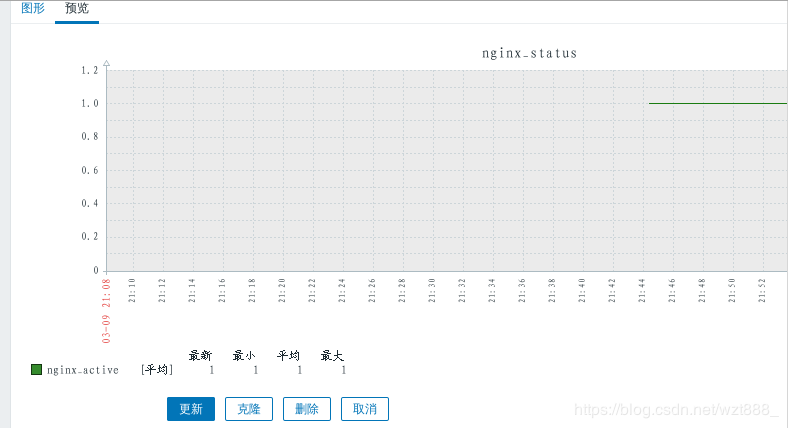
# 效果呈现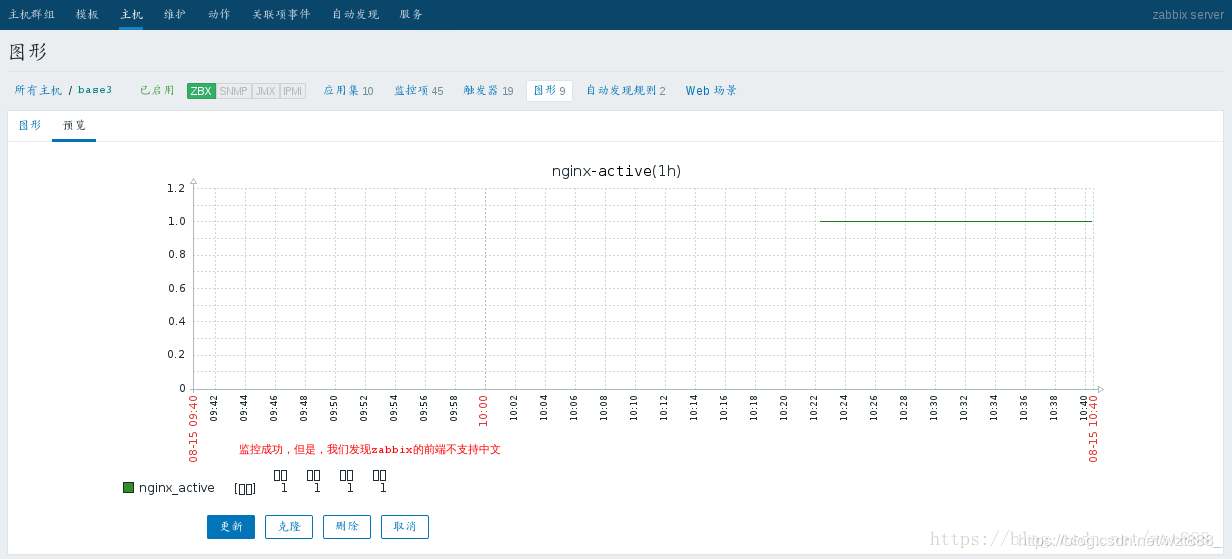
# 我们现在来实现中文的显示
# 在服务端
[root@base2 ~]# cd /usr/share/zabbix/fonts/
[root@base2 fonts]# ls
graphfont.ttf simkai.ttf
注:simkai.ttf 这个字体文件是我从windows上下载的
[root@base2 fonts]# cd ../include/
[root@base2 include]# vim defines.inc.php # 用simkai替换graphfont
# 刷新网页,就可以显示中文了

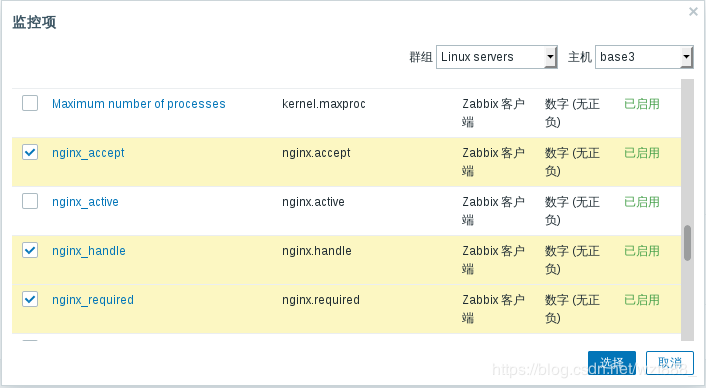
# 添加其他监控项
# 在nginx客户端查看参数
[root@base3 zabbix_agentd.d]# curl http://127.0.0.1/status
[root@base3 zabbix_agentd.d]# curl -s http://127.0.0.1/status | awk NR==3 | awk '{print $1}'
107
[root@base3 zabbix_agentd.d]# curl -s http://127.0.0.1/status | awk NR==3 | awk '{print $2}'
109
[root@base3 zabbix_agentd.d]# curl -s http://127.0.0.1/status | awk NR==3 | awk '{print $3}'
110
[root@base3 zabbix_agentd.d]# vim userparameter_nginx.conf
UserParameter=nginx.active,curl -s http://127.0.0.1/status | grep Active | awk '{print $3}'
UserParameter=nginx.accept,curl -s http://127.0.0.1/status | awk NR==3 | awk '{print $1}'
UserParameter=nginx.required,curl -s http://127.0.0.1/status | awk NR==3 | awk '{print $1}'
UserParameter=nginx.handle,curl -s http://127.0.0.1/status | awk NR==3 | awk '{print $1}'
[root@base3 zabbix_agentd.d]# systemctl restart zabbix-agent
1
# 在服务端测试
[root@base2 ~]# zabbix_get -s 172.25.78.13 -p 10050 -k "nginx.accept"
124
[root@base2 ~]# zabbix_get -s 172.25.78.13 -p 10050 -k "nginx.required"
125
[root@base2 ~]# zabbix_get -s 172.25.78.13 -p 10050 -k "nginx.handle"
126
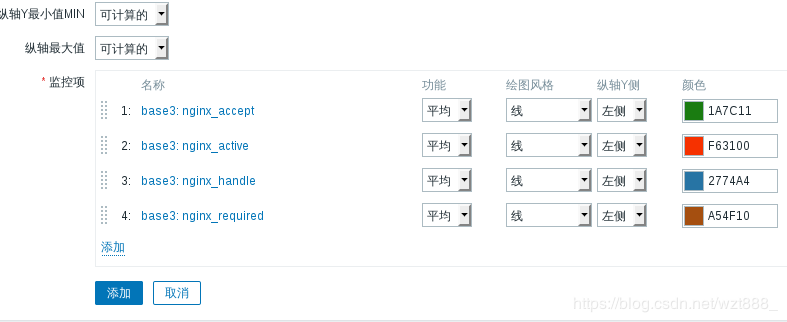
# 在网页上添加 

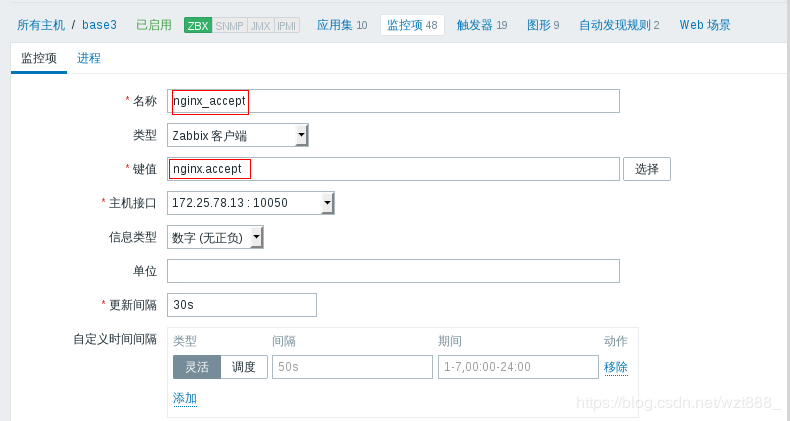
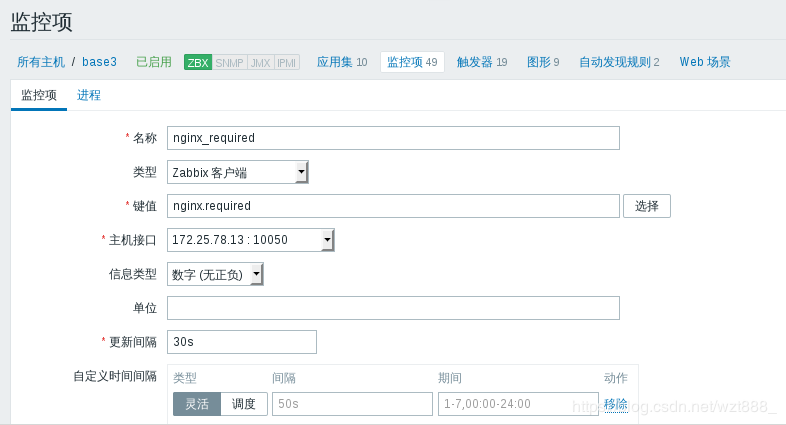
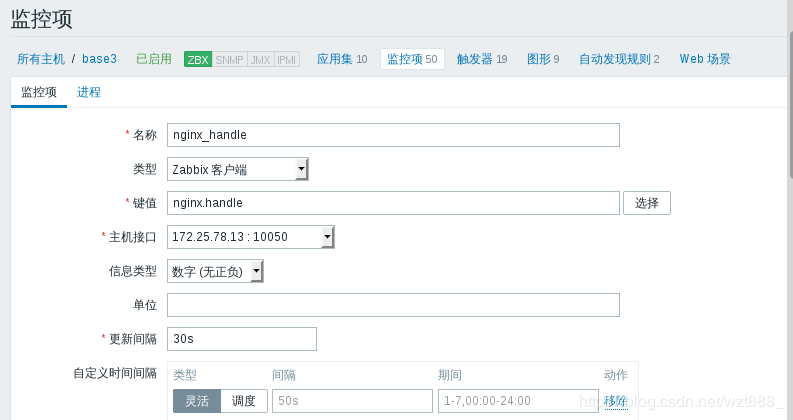
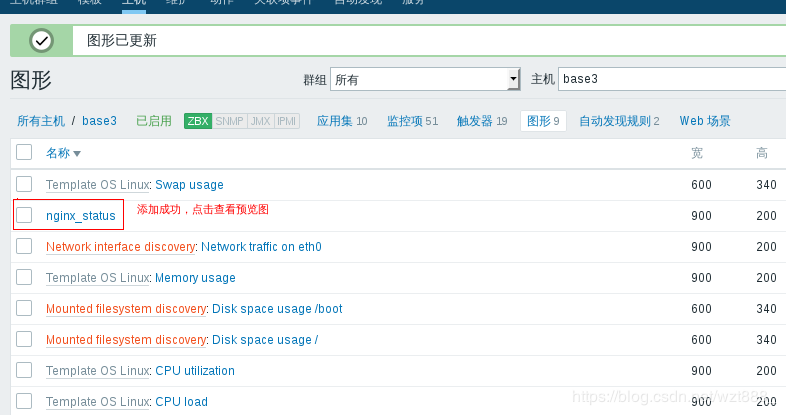
# 效果呈现

2.用percona监控zabbix server数据库
因为Zabbix自带的MySQL监控没有提供可以直接使用的Key,所以一般不采用,业界都使用
Percona Monitoring Plugins 监控 MySQL的方式
Percona介绍
Percona 为 MySQL 数据库服务器进行了改进,在功能和性能上较 MySQL 有着很显著的提升。
该版本提升了在高负载情况下的 InnoDB 的性能、为 DBA 提供一些非常有用的性能诊断工具;另
外有更多的参数和命令来控制服务器行为。
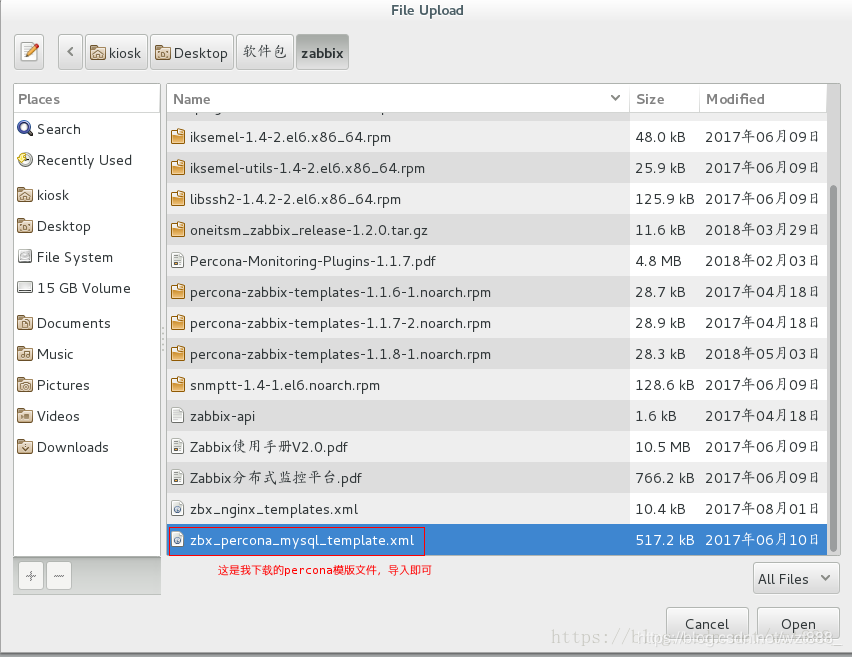
[root@base2 ~]# rpm -ivh percona-zabbix-templates-1.1.8-1.noarch.rpm # 安装percoan插件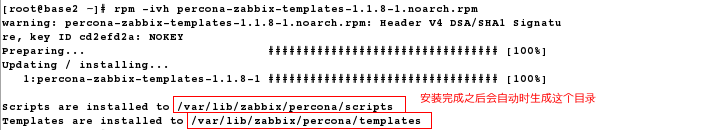
[root@base2 ~]# cd /var/lib/zabbix/percona/scripts/
[root@base2 scripts]# ls
get_mysql_stats_wrapper.sh ss_get_mysql_stats.php
[root@base2 scripts]# cd ../templates/
[root@base2 templates]# ls
userparameter_percona_mysql.conf
zabbix_agent_template_percona_mysql_server_ht_2.0.9-sver1.1.8.xml
[root@base2 templates]# cp userparameter_percona_mysql.conf /etc/zabbix/zabbix_agentd.d/ # 复制zabbix代理配置
[root@base2 templates]# cd /etc/zabbix/zabbix_agentd.d/
[root@base2 zabbix_agentd.d]# ls
userparameter_mysql.conf userparameter_percona_mysql.conf
[root@base2 zabbix_agentd.d]# cd -
/var/lib/zabbix/percona/templates
[root@base2 templates]# cd ../scripts/
[root@base2 scripts]# ls
get_mysql_stats_wrapper.sh ss_get_mysql_stats.php
[root@base2 scripts]# vim ss_get_mysql_stats.php.cnf
<?php
$mysql_user = 'root';
$mysql_pass = 'redhat'; # 这是我数据库中的root用户密码,根据自己实际情况写
[root@base2 scripts]# cd /var/lib/zabbix/
[root@base2 zabbix]# vim .my.cnf
[mysql]
host = localhost
user = root
password = redhat # 这是我数据库中的root用户密码,根据自己实际情况写
socket = /var/lib/mysql/mysql.sock
[mysqladmin]
host = localhost
user = root
password = redhat
socket = /var/lib/mysql/mysql.sock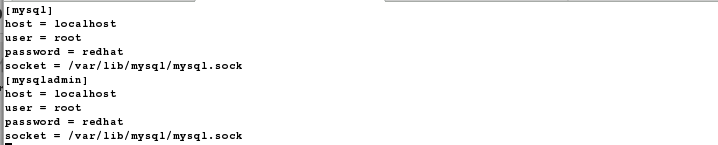
[root@base2 zabbix]# systemctl restart zabbix-agent
[root@base2 scripts]# /var/lib/zabbix/percona/scripts/get_mysql_stats_wrapper.sh gg # 测试,只要有数据返回,就代表正确
0
[root@base2 scripts]# cd /tmp/
[root@base2 tmp]# ls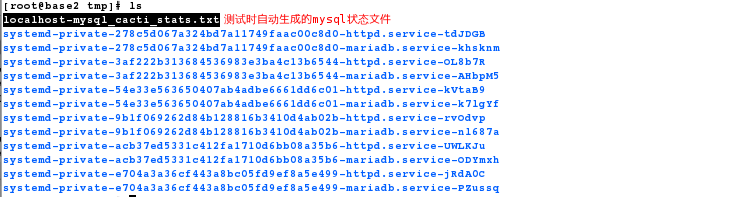
[root@base2 tmp]# rm -fr localhost-mysql_cacti_stats.txt
1
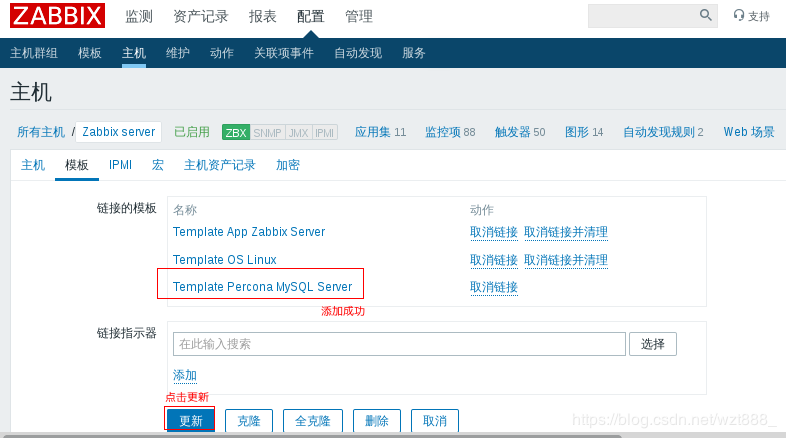
在网页上添加percona模板


3.实现java的监控
[root@base3 ~]# ls
apache-tomcat-8.5.24.tar.gz
jdk-8u121-linux-x64.rpm
[root@base3 ~]# rpm -ivh jdk-8u121-linux-x64.rpm
[root@base3 ~]# tar zxf apache-tomcat-8.5.24.tar.gz -C /usr/local/
[root@base3 ~]# cd /usr/local/
[root@base3 local]# ln -s apache-tomcat-8.5.24/ tomcat
[root@base3 local]# cd tomcat/
[root@base3 tomcat]# ls
bin conf lib LICENSE logs NOTICE RELEASE-NOTES RUNNING.txt temp webapps work
[root@base3 tomcat]# cd bin/
[root@base3 bin]# vim catalina.sh
CATALINA_OPTS='-Dcom.sun.management.jmxremote
-Dcom.sun.management.jmxremote.port=8888
-Dcom.sun.management.jmxremote.authenticate=false
-Dcom.sun.management.jmxremote.ssl=false'
[root@base3 bin]# vim catalina.sh
[root@base3 bin]# ./startup.sh 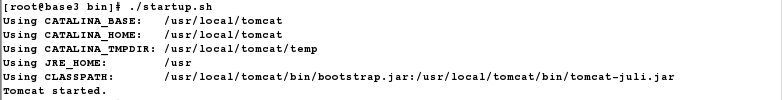
[root@base3 bin]# netstat -antlp | grep java

[root@base2 ~]# ls
zabbix-java-gateway-4.0.5-1.el7.x86_64.rpm
[root@base2 ~]# rpm -ivh zabbix-java-gateway-4.0.5-1.el7.x86_64.rpm # 有依赖,所以我们用yum来解决依赖性
[root@base2 ~]# yum install -y zabbix-java-gateway-4.0.5-1.el7.x86_64.rpm
[root@base2 ~]# cd /etc/zabbix/
[root@base2 zabbix]# ls
web zabbix_agentd.d zabbix_java_gateway_logback.xml
zabbix_agentd.conf zabbix_java_gateway.conf zabbix_server.conf
[root@base2 zabbix]# systemctl start zabbix-java-gateway
[root@base2 zabbix]# netstat -antlp | grep 10052
[root@base2 zabbix]# vim zabbix_server.conf
288 JavaGateway=172.25.78.12
296 JavaGatewayPort=10052
304 StartJavaPollers=5
[root@base2 zabbix]# zabbix_server -R config_cache_reload
[root@base2 zabbix]# systemctl restart zabbix-server
# 在web网页上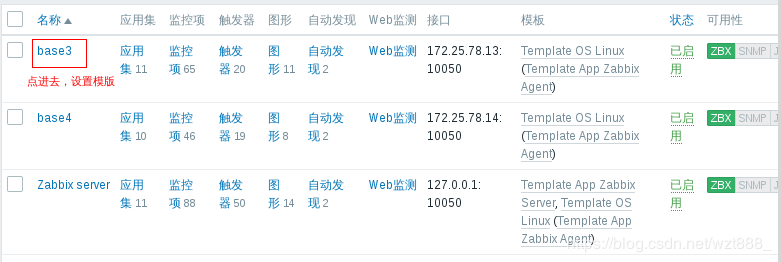
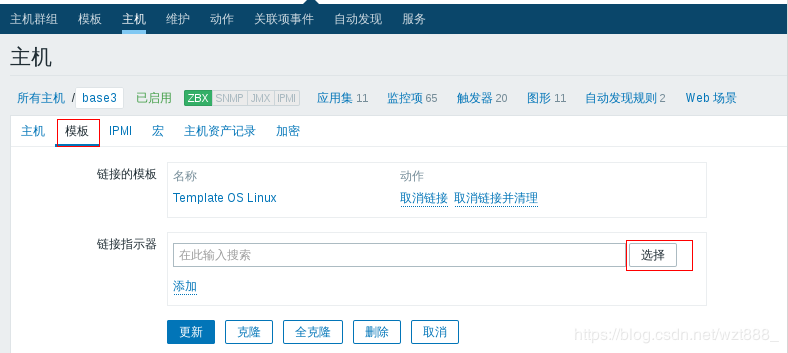
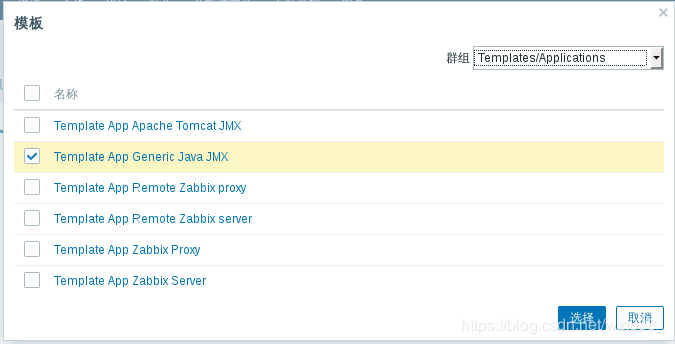
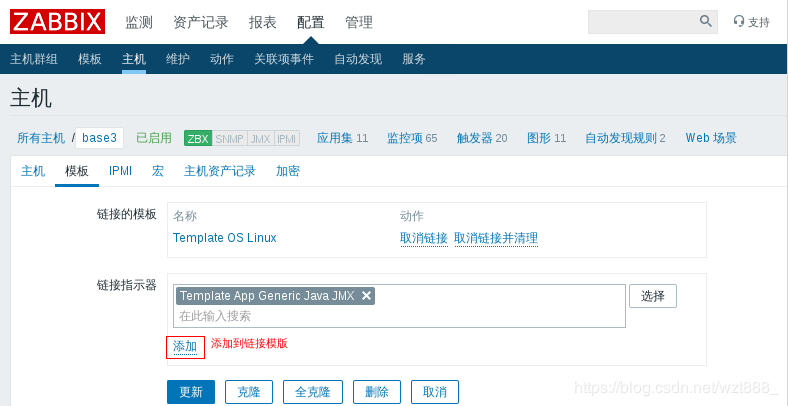

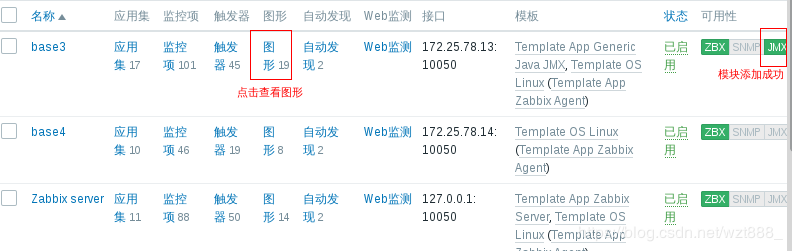
# 添加JMX接口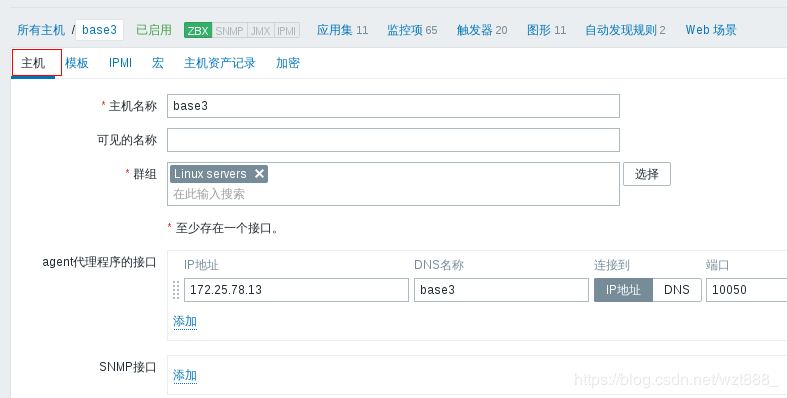
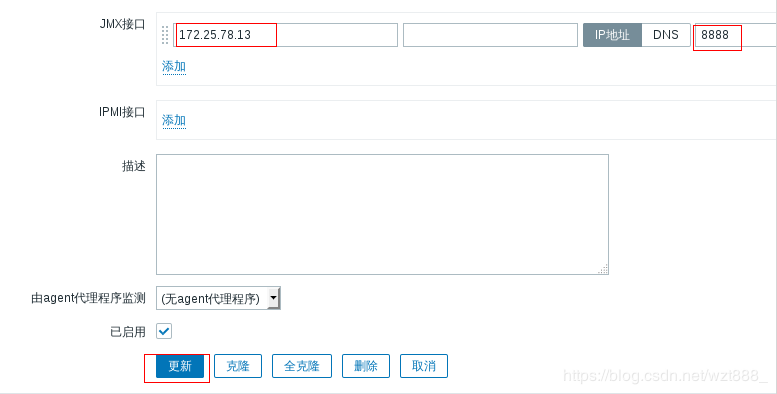
刷新网页,发现JMX模块添加成功,可以应用