一,使用OLS拟合
import pandas as pd
import statsmodels.api as sm
# 数据的导入
data = pd.read_table("E:\python\part 2\017\TRD_Index.txt",sep='	')

# 目标数据的提取

# 根据 行标签 提取数据
sh_data = data[data['Indexcd']==1]
sz_data = data[data.Indexcd==399106]
# 提取 列 数据
sh_ret = sh_data.Retindex
sz_ret = sz_data['Retindex']
# 索引一致化
# print(sh_ret.index)
# print(sz_ret.index)
sz_ret.index = sh_ret.index

# 构造回归模型
model = sm.OLS(sh_ret,sm.add_constant(sz_ret)).fit()
print(model.summary())
模型结果:
OLS Regression Results
==============================================================================
Dep. Variable:               Retindex   R-squared:                       0.825
Model:                            OLS   Adj. R-squared:                  0.825
Method:                 Least Squares   F-statistic:                     5698.
Date:                Thu, 14 Dec 2017   Prob (F-statistic):               0.00
Time:                        19:11:39   Log-Likelihood:                 4520.3
No. Observations:                1211   AIC:                            -9037.
Df Residuals:                    1209   BIC:                            -9026.
Df Model:                           1
Covariance Type:            nonrobust
==============================================================================
                 coef    std err          t      P>|t|      [95.0% Conf. Int.]
------------------------------------------------------------------------------
const         -0.0003      0.000     -1.747      0.081        -0.001  3.58e-05
Retindex       0.7603      0.010     75.487      0.000         0.741     0.780
==============================================================================
Omnibus:                      154.029   Durbin-Watson:                   1.821
Prob(Omnibus):                  0.000   Jarque-Bera (JB):              382.039
Skew:                           0.701   Prob(JB):                     1.10e-83
Kurtosis:                       5.367   Cond. No.                         60.5
==============================================================================

Warnings:
[1] Standard Errors assume that the covariance matrix of the errors is correctly specified.

Process finished with exit code 0
- 可以得出R的平方为:0.825,可以解释82.5%的方差。
- 截距项为-0.0003,p值为0.081,无法通过通过置信度为0.05的检验,可以推断该模型不含截距项,即为0.
- 斜率为0.7603,通过检验,显著不为0.
- 模型为:sh_ret = -0.0003 + 0.7603 sz_ret + e
绘图比较:
# 绘图
# 原始数据和拟合数据的对比
plt.scatter(sz_ret.values,sh_ret.values,color='b')
plt.plot(sz_ret.values,model.fittedvalues,color='r')
plt.show()

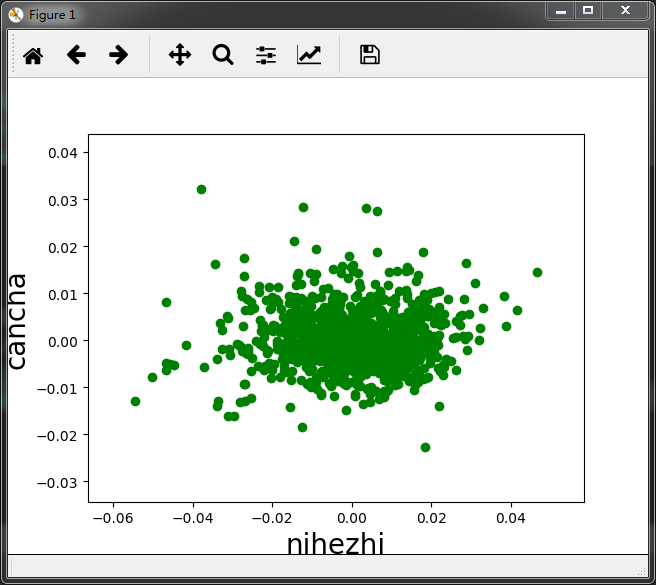
拟合检验:
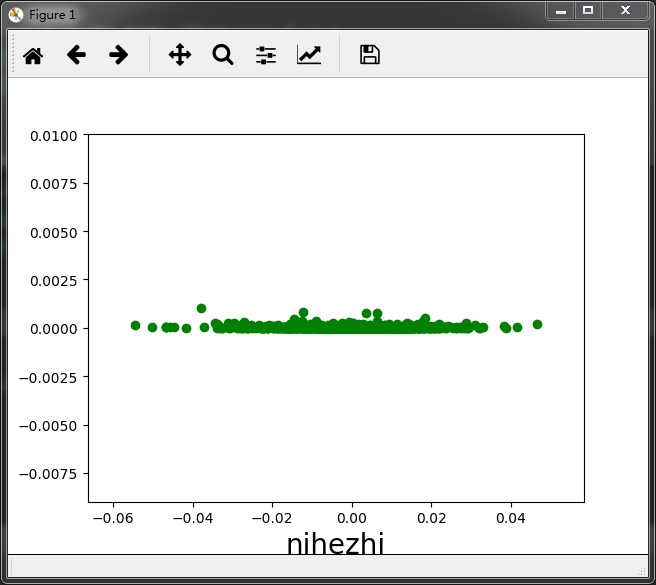
# 拟合检验

# 拟合值和残余项的检验(随机分布)
plt.scatter(model.fittedvalues,model.resid,color = 'g')
plt.xlabel('nihezhi',size =20)
plt.ylabel('cancha',size=20)
plt.show()

# 拟合值和残余项的检验(水平的宽度一致的条带)
plt.scatter(model.fittedvalues,model.resid**2,color = 'g')
plt.xlabel('nihezhi',size =20)
plt.ylabel('cancha',size=20)
plt.show()


# 正态性检验
# sm.qqplot(model.resid_pearson,stats.norm,line='45')
二,使用np的多项式拟合。
import pandas as pd
import statsmodels.api as sm
import numpy as np
import matplotlib.pyplot as plt
# 数据的导入
data = pd.read_table("E:\python\part 2\017\TRD_Index.txt",sep='	')

# 目标数据的提取

# 根据 行标签 提取数据
sh_data = data[data['Indexcd']==1]
sz_data = data[data.Indexcd==399106]
# 提取 列 数据
sh_ret = sh_data.Retindex
sz_ret = sz_data['Retindex']
# 索引一致化
# print(sh_ret.index)
# print(sz_ret.index)
sz_ret.index = sh_ret.index

# 回归拟合
reg = np.polyfit(sz_ret.values,sh_ret.values,deg=1)
print(reg)                # 查看模型的参数
reg_fc = np.poly1d(reg)
print(reg_fc)             # 查看回归方程

# 查看拟合值
ry = np.polyval(reg,sz_ret.values)
print(ry[:5])

# 绘图
plt.scatter(sz_ret.values,sh_ret.values,color="b")
plt.plot(sz_ret.values,ry,color='r')
plt.show()
对比OLS拟合可以看出:
- 拟合方程相同。
- 绘制的图形也是相同的。
- OLS拟合的结果更为专业。