设置plot的风格和样式
点和线的样式
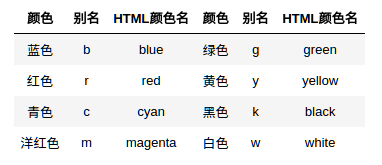
颜色

参数color或c

五种定义颜色值的方式

别名
color='r'

合法的HTML颜色名
color = 'red'

HTML十六进制字符串
color = '#eeefff'

归一化到[0, 1]的RGB元组
color = (0.3, 0.3, 0.4)

灰度
color = (0.1)
透明度

y = np.arange(1, 3)
plt.plot(y, c="red", alpha=0.1);    # 设置透明度
plt.plot(y+1, c="red", alpha=0.5);
plt.plot(y+2, c="red", alpha=0.9);
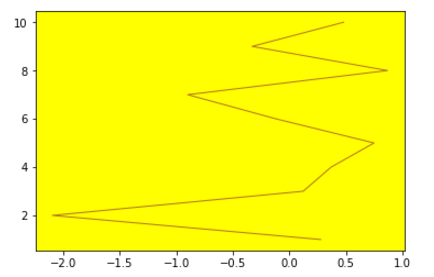
设置背景色
通过plt.subplot()方法传入facecolor参数,来设置坐标轴的背景色

plt.subplot(facecolor='orange');
plt.plot(np.random.randn(10),np.arange(1,11))
线型

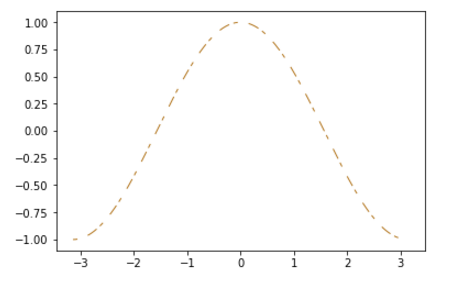
不同宽度破折线

# 第一段线2个点的宽度,接下来的空白区5个点的宽度,第二段线5个点的宽度,空白区2个点的宽度,以此类推
plt.plot(np.linspace(-np.pi, np.pi, 256, endpoint=True),
         np.cos(np.linspace(-np.pi, np.pi, 256, endpoint=True)),
         dashes=[2, 5, 5, 2]);
点型

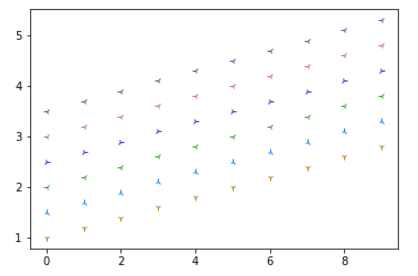
y = np.arange(1, 3, 0.2)
plt.plot(y, '1', y+0.5, '2', y+1, '3', y+1.5,'4');
plt.plot(y+2, '3') #不声明marker,默认ls = None
plt.plot(y+2.5,marker = '3') #声明了marker,ls 默认是实线
plt.show()
多参数连用

颜色、点型、线型

x = np.linspace(0, 5, 10)
plt.plot(x,3*x,'r-.')
plt.plot(x, x**2, 'b^:') # blue line with dots
plt.plot(x, x**3, 'go-.') # green dashed line
plt.show()
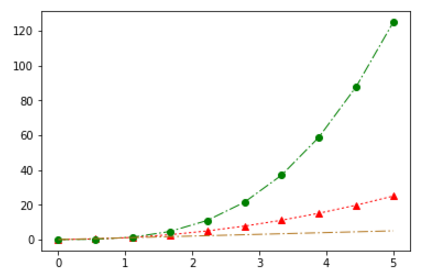
更多点和线的设置

y = np.arange(1, 3, 0.3)
plt.plot(y, color='blue',
         linestyle='dashdot',
         linewidth=4, marker='o',
         markerfacecolor='red',
         markeredgecolor='black',
         markeredgewidth=3,
         markersize=12);
plt.show()
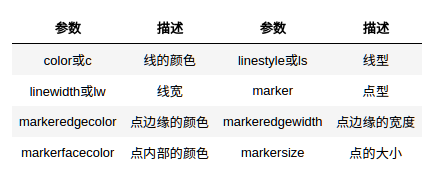
在一条语句中为多个曲线进行设置
多个曲线同一设置
plt.plot(x1, y1, x2, y2, fmt, ...)
多个曲线不同设置
plt.plot(x1, y1, fmt1, x2, y2, fmt2, ...)
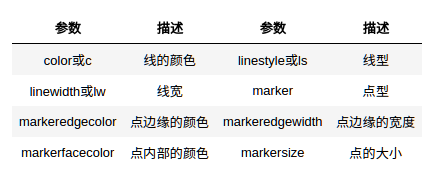
在一条语句中为多个曲线进行设置
多个曲线同一设置
plt.plot(x1, y1, x2, y2, fmt, ...)
多个曲线不同设置
plt.plot(x1, y1, fmt1, x2, y2, fmt2, ...)
三种设置方式

向方法传入关键字参数


对实例使用一系列的setter方法

x = np.arange(0,10)
y = np.random.randint(10,30,size = 10)
line,= plt.plot(x, y)
line2 = plt.plot(x,y*2,x,y*3)
line.set_linewidth(5)
line2[1].set_marker('o')
print(line,line2)


使用setp()方法
line = plt.plot(x, y)
plt.setp(line, 'linewidth', 1.5,'color','r','marker','o','linestyle','--')
X、Y轴坐标刻度
xticks()和yticks()方法

x = [5, 3, 7, 2, 4, 1]
plt.plot(x);
plt.xticks(range(len(x)), ['a', 'b', 'c', 'd', 'e', 'f']); # 传入位置和标签参数,以修改坐标轴刻度
plt.yticks(range(1, 8, 2));
plt.show()

面向对象方法

set_xticks、set_yticks、set_xticklabels、set_yticklabels方法


fig = plt.figure(figsize=(10, 4))
ax = fig.add_subplot(111)

x = np.linspace(0, 5, 100)

ax.plot(x, x**2, x, x**3, lw=2)

ax.set_xticks([1, 2, 3, 4, 5])
ax.set_xticklabels(['a','b','c','d','e'], fontsize=18)

yticks = [0, 50, 100, 150]
ax.set_yticks(yticks)
ax.set_yticklabels([y for y in yticks], fontsize=18); # use LaTeX formatted labels

正弦余弦:LaTex语法,用$pi$等表达式在图表上写上希腊字母

x = np.arange(-np.pi,np.pi,0.01)
plt.figure(figsize=(12,9))
plt.plot(x,np.sin(x),x,np.cos(x))

plt.axis([x.min()-1,x.max()+1,-1.2,1.2])

#xticks:参数一刻度,参数二,对应刻度上的值
plt.xticks(np.arange(-np.pi,np.pi+1,np.pi/2),
           ['$-delta$','$-pi$/2','0','$pi$/2','$pi$'],size = 20)

plt.yticks([-1,0,1],['min','0','max'],size = 20)

plt.show()

2020-05-24