profile是用于追踪程序执行调用流程的工具,类似于perf中的-g指令
相比perf -g而言,profile功能化更加细分,可以根据需要选择追踪层面,例如-U(用户要调用流程) -K (内核态调用流程)
下面具体介绍该工具的使用
采用profile --help,我们可以看到如下介绍:
usage: profile [-h] [-p PID] [-U | -K] [-F FREQUENCY | -c COUNT] [-d] [-a]
               [-f] [--stack-storage-size STACK_STORAGE_SIZE] [-C CPU]
               [duration]

Profile CPU stack traces at a timed interval

positional arguments:
  duration              duration of trace, in seconds   # profile的持续时间

optional arguments:
  -h, --help            show this help message and exit
  -p PID, --pid PID     profile this PID only           # 只追踪该pid的调用流程
  -U, --user-stacks-only                   # 查看用户态函数调用流程
                        show stacks from user space only (no kernel space
                        stacks)
  -K, --kernel-stacks-only                  # 只查看内核态调用流程
                        show stacks from kernel space only (no user space
                        stacks)
  -F FREQUENCY, --frequency FREQUENCY                   # profile追踪采样频率  例如: -F 99  表示按照99hz的频率进行采样,默认是采用的49hz
                        sample frequency, Hertz
  -c COUNT, --count COUNT                   # 选择采样次数 -c 5表示在周期内采样5次,-c和-F两者不能同时使用
                        sample period, number of events
  -d, --delimited       insert delimiter between kernel/user stacks  # 在内核和用户态之间插入分界符 “---”
  -a, --annotations     add _[k] annotations to kernel frames        # 在显示的内核函数后面标记 '[k]'标识
  -f, --folded          output folded format, one line per stack (for flame #采用横向线上模式 xxx;xxx_1;xxxxx_2
                        graphs)
  --stack-storage-size STACK_STORAGE_SIZE                 # 设置调用栈的使用空间和默认支持空间大小
                        the number of unique stack traces that can be stored
                        and displayed (default 16384)
  -C CPU, --cpu CPU     cpu number to run profile on           # 允许几个cpu运行profile程序

examples:
    ./profile             # profile stack traces at 49 Hertz until Ctrl-C
    ./profile -F 99       # profile stack traces at 99 Hertz
    ./profile -c 1000000  # profile stack traces every 1 in a million events
    ./profile 5           # profile at 49 Hertz for 5 seconds only
    ./profile -f 5        # output in folded format for flame graphs
    ./profile -p 185      # only profile threads for PID 185
    ./profile -U          # only show user space stacks (no kernel)
    ./profile -K          # only show kernel space stacks (no user)
下面对相关重要指令进行测试分析:
- profile -f
在没有添加-f参数时,可看出是一行线上一个函数调用信息
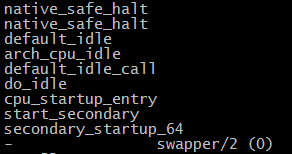
加入-f参数后,采用每行递增线上函数调用信息。

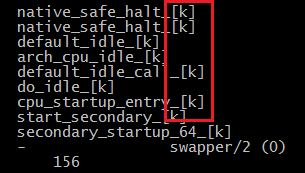
- profile -d :用于将内核态和用户态函数通过"--"分割开来,如下图红色框框所示

3.profile -F :用于设置该工具采样频率

4. profile -K -a :用于仅显示内核调用函数,并且在函数后面增加"_[K]"标识 (156标识进程id号)
5. profile -c :在采样周期内对每一个线程xx个event进行采样
