简单的线性回归预测房价
#!/usr/bin/env python
# encoding: utf-8

"""
@version:
@author: --*--.
@file: LinearRegression.py
@time: 2018/11/1 11:05
@desc:
"""

# Required Packages
import matplotlib.pyplot as plt
import numpy as np
from sklearn import linear_model


def get_data():
    """
    生成随机的线性数据集
    :return:
    """
    x = 100 * np.random.rand(100, 1).astype(np.float32)
    y = 2 * x + 10  # 直线
    # y = 7 * x ** 5 + 3 * x + 10  # 曲线
    y += 50 * np.random.rand(100, 1).astype(np.float32)

    return x, y


# Function for Fitting our data to Linear model
def linear_model_main(X_parameters, Y_parameters, predict_value):
    # Create linear regression object
    regr = linear_model.LinearRegression()
    regr.fit(X_parameters, Y_parameters,sample_weight=None) # 权重
    predict_outcome = regr.predict(predict_value)

    predictions = {}
    predictions['intercept'] = regr.intercept_
    predictions['coefficient'] = regr.coef_
    predictions['predicted_value'] = predict_outcome
    return predictions


# Function to show the resutls of linear fit model
def show_linear_line(X_parameters, Y_parameters, predictvalue):
    # Create linear regression object
    regr = linear_model.LinearRegression()
    regr.fit(X_parameters, Y_parameters)

    fig = plt.figure()
    ax1 = fig.add_subplot(111)
    # 设置标题
    ax1.set_title('Housing Forecast')

    ax1.scatter(X_parameters, Y_parameters, color='blue', marker='*')
    ax1.plot(X_parameters, regr.predict(X_parameters), color='c', linewidth=1)

    # 画点
    ax1.scatter(predictvalue, regr.predict(predictvalue), color='red')

    # 画水平虚线
    plt.axvline(x=predictvalue, ls='dotted', color='y')
    plt.axhline(y=regr.predict(predictvalue), ls='dotted', color='y')

    plt.xlabel('x:area')
    plt.ylabel('y:price')

    plt.show()


if __name__ == "__main__":
    X, Y = get_data()
    predictvalue = 90  # 面积
    # 新版必须2维哦
    predictvalue = np.array(predictvalue,dtype=np.int32).reshape(1, -1)

    result = linear_model_main(X, Y, predictvalue)

    print("截距-Intercept value ", result['intercept'])
    print("回归系数-coefficient", result['coefficient'])
    print("y-Predicted value: ", result['predicted_value'])
    print("面积 %d 的价格预测为 %d" % (predictvalue, result['predicted_value']))

    show_linear_line(X, Y, predictvalue)
输出结果为:
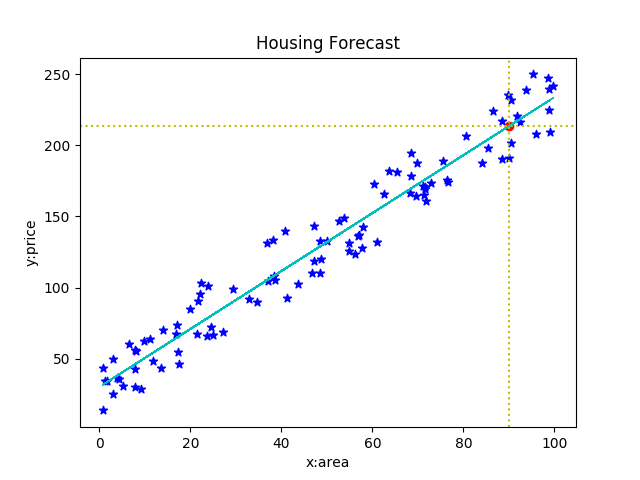
/usr/bin/python3.5 /home/think-hxr/PycharmProjects/MachineLearningAlgorithms/LinearRegression.py
Intercept value  [ 38.77058411]
coefficient [[ 1.92119944]]
Predicted value:  [[ 211.67853379]]
面积 90 的价格预测为 211
画图: