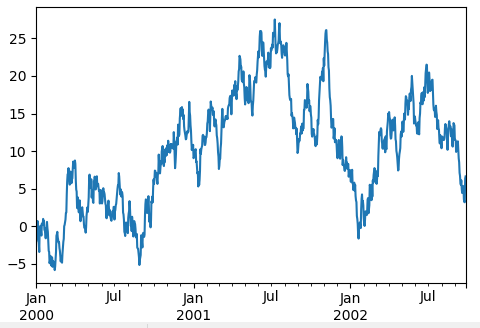
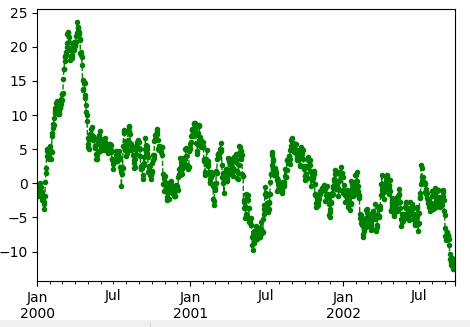
import pandas as pd
import numpy as np
np.set_printoptions(threshold=np.inf)

#生成一个二维数组,第一列为日期,第二列为正态分布值
ts = pd.Series(np.random.randn(1000),index=pd.date_range('1/1/2000', periods=1000))

#对值进行累加
ts = ts.cumsum()

#展现变量的趋势变化二维线画图函数
#ts.plot()

ts.plot(color='green', marker='.', linestyle='dashed', linewidth=1, markersize=6)
生成可视化的图片:
ts.plot() ts.plot(color='green', marker='.', linestyle='dashed', linewidth=1, markersize=6)
DataFrame 的 plot()
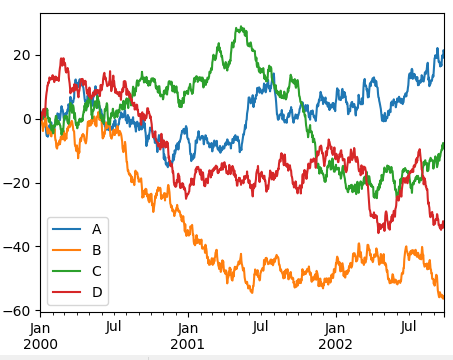
import pandas as pd
import numpy as np
np.set_printoptions(threshold=np.inf)
import matplotlib.pyplot as plt


#生成一个二维数组,第一列为日期,第二列为正态分布值
ts = pd.Series(np.random.randn(1000),index=pd.date_range('1/1/2000', periods=1000))

#对值进行累加
ts = ts.cumsum()

#DataFrame 的 plot()
df = pd.DataFrame(np.random.randn(1000, 4), index=ts.index,columns=['A', 'B', 'C', 'D'])
print (df)

#对值进行累加
df = df.cumsum()

#展现变量的趋势变化二维线画图函数
plt.figure(figsize=(4,3),facecolor='blue');
df.plot();
生成的图:
扩展:
https://pandas.pydata.org/pandas-docs/stable/user_guide/visualization.html#visualization