结构:
/www
|
|-- /static
|....|-- jquery-3.1.1.js
|....|-- echarts.js(echarts3是单文件!!)
|
|-- /templates
|....|-- index.html
|
|-- app.py
|
|-- create_db.py
一、先准备数据
# create_db.py
# 只运行一次!!!

import sqlite3

# 连接
conn = sqlite3.connect('mydb.db')
c = conn.cursor()

# 创建表
c.execute('''DROP TABLE IF EXISTS weather''')
c.execute('''CREATE TABLE weather (month text, evaporation text, precipitation text)''')

# 数据
# 格式:月份,蒸发量,降水量
purchases = [('1月', 2, 2.6),
             ('2月', 4.9, 5.9),
             ('3月', 7, 9),
             ('4月', 23.2, 26.4),
             ('5月', 25.6, 28.7),
             ('6月', 76.7, 70.7),
             ('7月', 135.6, 175.6),
             ('8月', 162.2, 182.2),
             ('9月', 32.6, 48.7),
             ('10月', 20, 18.8),
             ('11月', 6.4, 6),
             ('12月', 3.3, 2.3)
            ]

# 插入数据
c.executemany('INSERT INTO weather VALUES (?,?,?)', purchases)

# 提交!!!
conn.commit()

# 查询方式一
for row in c.execute('SELECT * FROM weather'):
    print(row)


# 查询方式二
c.execute('SELECT * FROM weather')
print(c.fetchall())


# 查询方式二_2
res = c.execute('SELECT * FROM weather')
print(res.fetchall())


# 关闭
conn.close()
二、异步数据加载
一次性整体加载所有数据
由如下函数实现:
@app.route("/weather", methods=["GET"])
def weather():
    if request.method == "GET":
        res = query_db("SELECT * FROM weather")

    return jsonify(month = [x[0] for x in res],
                   evaporation = [x[1] for x in res],
                   precipitation = [x[2] for x in res])
此函数用于处理ajax,返回json格式。形如:
{
    month: ['1月','2月',...],
    evaporation: [3.1, 4, 4.6, ...],
    precipitation: [...]
}
完整app.py文件:
# app.py

import sqlite3
from flask import Flask, request, render_template, jsonify

app = Flask(__name__)


def get_db():
    db = sqlite3.connect('mydb.db')
    db.row_factory = sqlite3.Row
    return db


def query_db(query, args=(), one=False):
    db = get_db()
    cur = db.execute(query, args)
    db.commit()
    rv = cur.fetchall()
    db.close()
    return (rv[0] if rv else None) if one else rv


@app.route("/", methods=["GET"])
def index():
    return render_template("index.html")


@app.route("/weather", methods=["POST"])
def weather():
    if request.method == "POST":
        res = query_db("SELECT * FROM weather")

    return jsonify(month = [x[0] for x in res],
                   evaporation = [x[1] for x in res],
                   precipitation = [x[2] for x in res])


if __name__ == "__main__":
  app.run(debug=True)
三、使用echarts
ECharts3 开始不再强制使用 AMD 的方式按需引入,代码里也不再内置 AMD 加载器。因此引入方式简单了很多,只需要像普通的 JavaScript 库一样用 script 标签引入。
ECharts3 中实现异步数据的更新非常简单,在图表初始化后不管任何时候只要通过 jQuery 等工具异步获取数据后通过 setOption 填入数据和配置项就行。
ECharts3 中在更新数据的时候需要通过name属性对应到相应的系列,上面示例中如果name不存在也可以根据系列的顺序正常更新,但是更多时候推荐更新数据的时候加上系列的name数据。
index.html文件如下:
<!DOCTYPE html>
<html lang="en">
<head>
<meta charset="utf-8">
<title>ECharts3 Ajax</title>
<script src="{{ url_for('static', filename='jquery-3.1.1.js') }}"></script>
<script src="{{ url_for('static', filename='echarts.js') }}"></script>
</head>
<body>
<!--为ECharts准备一个具备大小(宽高)的Dom-->
<div id="main" style="height:500px;border:1px solid #ccc;padding:10px;"></div>
<script type="text/javascript">
var myChart = echarts.init(document.getElementById('main'));
// 显示标题,图例和空的坐标轴
myChart.setOption({
title: {
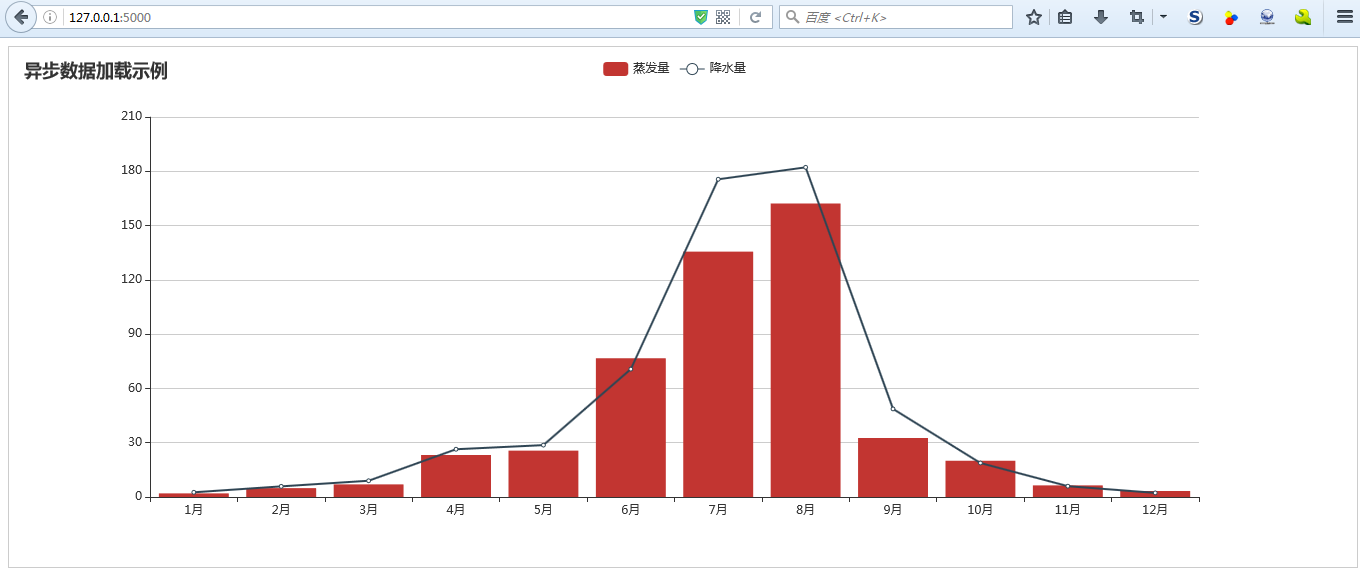
text: '异步数据加载示例'
},
tooltip: {},
legend: {
data:['蒸发量','降水量']
},
xAxis: {
data: []
},
yAxis: {},
series: [{
name: '蒸发量',
type: 'bar',
data: []
},{
name: '降水量',
type: 'line',
data: []
}]
});
myChart.showLoading(); // 显示加载动画
// 异步加载数据
$.get('/weather').done(function (data) {
myChart.hideLoading(); // 隐藏加载动画
// 填入数据
myChart.setOption({
xAxis: {
data: data.month
},
series: [{
name: '蒸发量', // 根据名字对应到相应的系列
data: data.evaporation.map(parseFloat) // 转化为数字(注意map)
},{
name: '降水量',
data: data.precipitation.map(parseFloat)
}]
});
});
</script>
</body>
</html>
效果图