1. Web Analytics Dashboard for NGINX Required NGINX json log format configuration below. https://grafana.com/grafana/dashboards/12559
log_format json_analytics escape=json '{'
                            '"msec": "$msec", ' # request unixtime in seconds with a milliseconds resolution
                            '"connection": "$connection", ' # connection serial number
                            '"connection_requests": "$connection_requests", ' # number of requests made in connection
                    '"pid": "$pid", ' # process pid
                    '"request_id": "$request_id", ' # the unique request id
                    '"request_length": "$request_length", ' # request length (including headers and body)
                    '"remote_addr": "$remote_addr", ' # client IP
                    '"remote_user": "$remote_user", ' # client HTTP username
                    '"remote_port": "$remote_port", ' # client port
                    '"time_local": "$time_local", '
                    '"time_iso8601": "$time_iso8601", ' # local time in the ISO 8601 standard format
                    '"request": "$request", ' # full path no arguments if the request
                    '"request_uri": "$request_uri", ' # full path and arguments if the request
                    '"args": "$args", ' # args
                    '"status": "$status", ' # response status code
                    '"body_bytes_sent": "$body_bytes_sent", ' # the number of body bytes exclude headers sent to a client
                    '"bytes_sent": "$bytes_sent", ' # the number of bytes sent to a client
                    '"http_referer": "$http_referer", ' # HTTP referer
                    '"http_user_agent": "$http_user_agent", ' # user agent
                    '"http_x_forwarded_for": "$http_x_forwarded_for", ' # http_x_forwarded_for
                    '"http_host": "$http_host", ' # the request Host: header
                    '"server_name": "$server_name", ' # the name of the vhost serving the request
                    '"request_time": "$request_time", ' # request processing time in seconds with msec resolution
                    '"upstream": "$upstream_addr", ' # upstream backend server for proxied requests
                    '"upstream_connect_time": "$upstream_connect_time", ' # upstream handshake time incl. TLS
                    '"upstream_header_time": "$upstream_header_time", ' # time spent receiving upstream headers
                    '"upstream_response_time": "$upstream_response_time", ' # time spend receiving upstream body
                    '"upstream_response_length": "$upstream_response_length", ' # upstream response length
                    '"upstream_cache_status": "$upstream_cache_status", ' # cache HIT/MISS where applicable
                    '"ssl_protocol": "$ssl_protocol", ' # TLS protocol
                    '"ssl_cipher": "$ssl_cipher", ' # TLS cipher
                    '"scheme": "$scheme", ' # http or https
                    '"request_method": "$request_method", ' # request method
                    '"server_protocol": "$server_protocol", ' # request protocol, like HTTP/1.1 or HTTP/2.0
                    '"pipe": "$pipe", ' # "p" if request was pipelined, "." otherwise
                    '"gzip_ratio": "$gzip_ratio", '
                    '"http_cf_ray": "$http_cf_ray",'
                    '"geoip_country_code": "$geoip_country_code"'
                    '}';

 access_log /var/log/nginx/json_access.log json_analytics;
2. My promtail configuration:
server:
  http_listen_port: 0
  grpc_listen_port: 0

positions:
  filename: /tmp/positions.yaml

clients:
  - url: https://USER:PASSWORD@logs-prod-us-central1.grafana.net/api/prom/push

scrape_configs:
    - job_name: system
      pipeline_stages:
      - replace:
          expression: '(?:[0-9]{1,3}.){3}([0-9]{1,3})'
          replace: '***'
      static_configs:
      - targets:
         - localhost
        labels:
         job: nginx_access_log
         host: appfelstrudel
         agent: promtail
         __path__: /var/log/nginx/*access.log
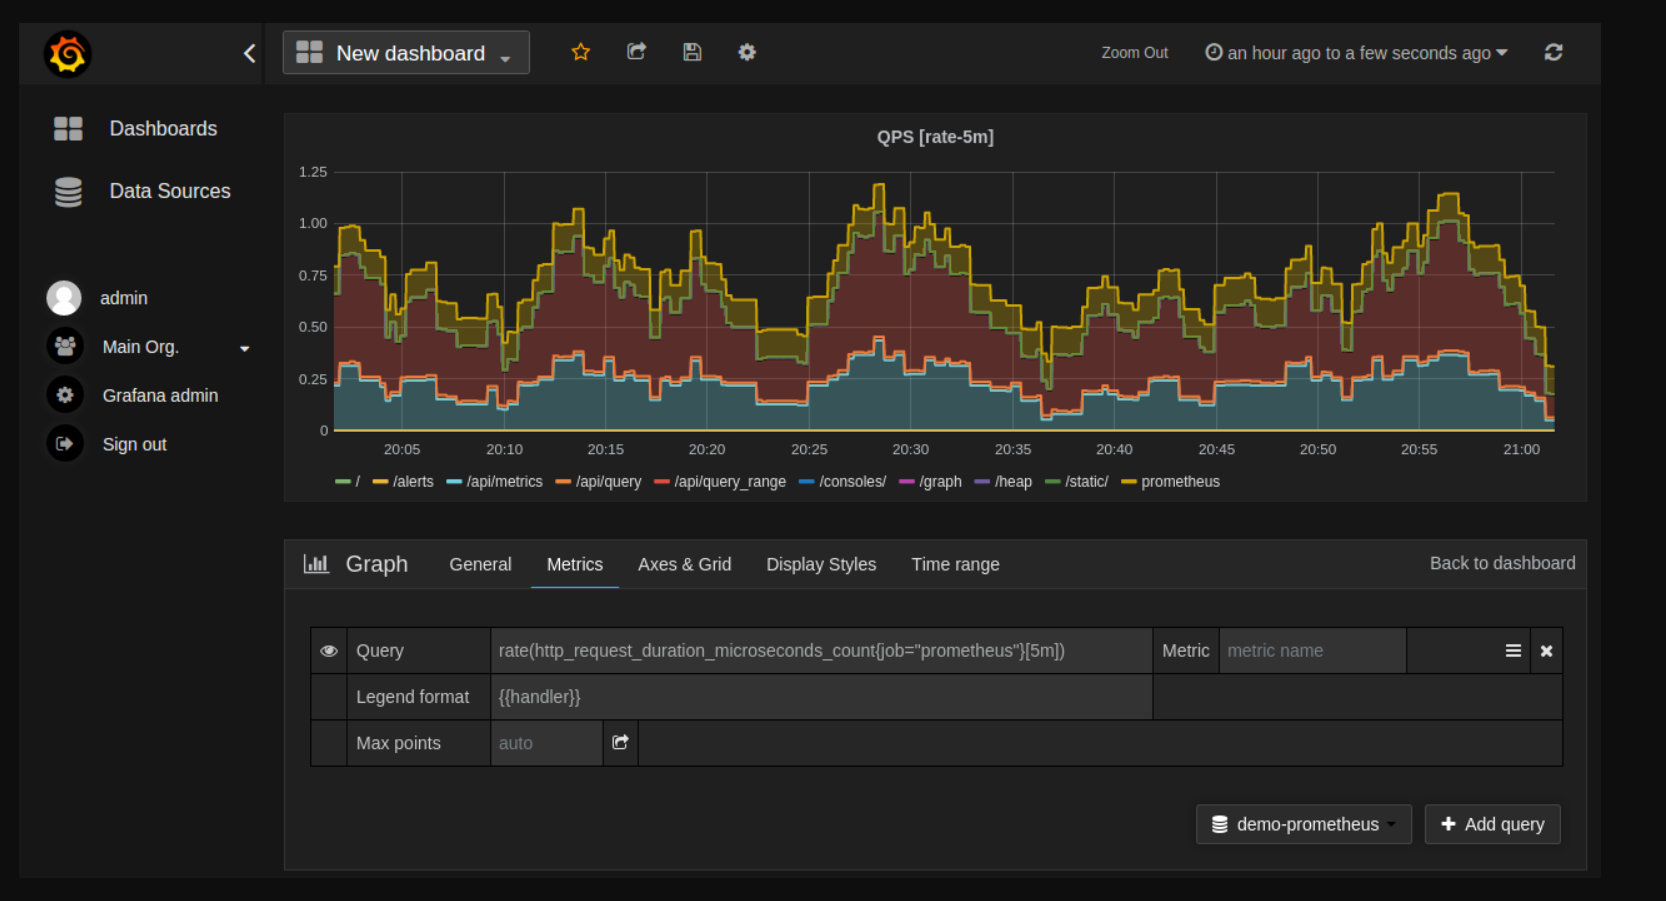
https://prometheus.io/docs/visualization/grafana/
grafana不错的书籍:https://yunlzheng.gitbook.io/prometheus-book/part-ii-prometheus-jin-jie/grafana/grafana-panels
4. 可视化Histogram
# TYPE prometheus_tsdb_compaction_duration histogram
prometheus_tsdb_compaction_duration_bucket{le="1"} 2
prometheus_tsdb_compaction_duration_bucket{le="2"} 36
Histogram用于统计样本数据的分布情况,其中标签le定义了分布桶Bucket的边界,如上所示,表示当前Prometheus共进行了36次数据压缩,总耗时为51.31017077500001ms。其中任务耗时在0~1ms区间内的为2次、在0~2ms区间范围内为36次,以此类推。