False-Color Plots
三变量方法表达,讲了一堆,没太仔细看。一些作图原则等等。
# -*- coding: utf-8 -*-
"""
Created on Sun Nov 02 14:47:33 2014

@author: Luo Hao at Tubic
"""

import matplotlib.pyplot as plt
import numpy as np

if __name__ == '__main__':
    x = np.linspace(-2.5, 2.5, 1001)
    aList = np.linspace(-2, 2, 5)
    #myfun = x**4/2 + a*x**2 - x/2 + a/4
    fig = plt.figure()
    ax = fig.add_subplot(111)
    for a in aList:
        ax.plot(x, x**4/2 + a*x**2 - x/2 + a/4)
    ax.set_ylim(-4, 4)
    ax.legend(['a = %d' % i for i in aList], 'best')
    plt.show()
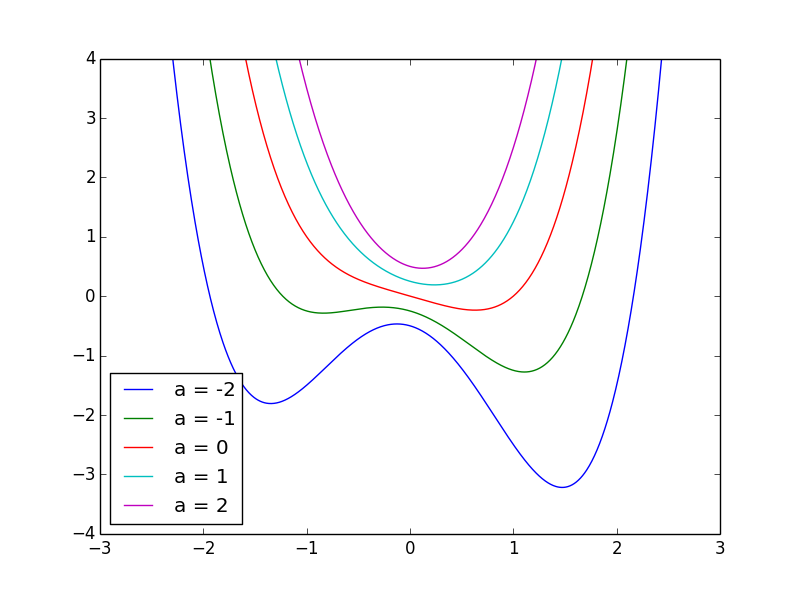
上图目测和原书不一样呢?
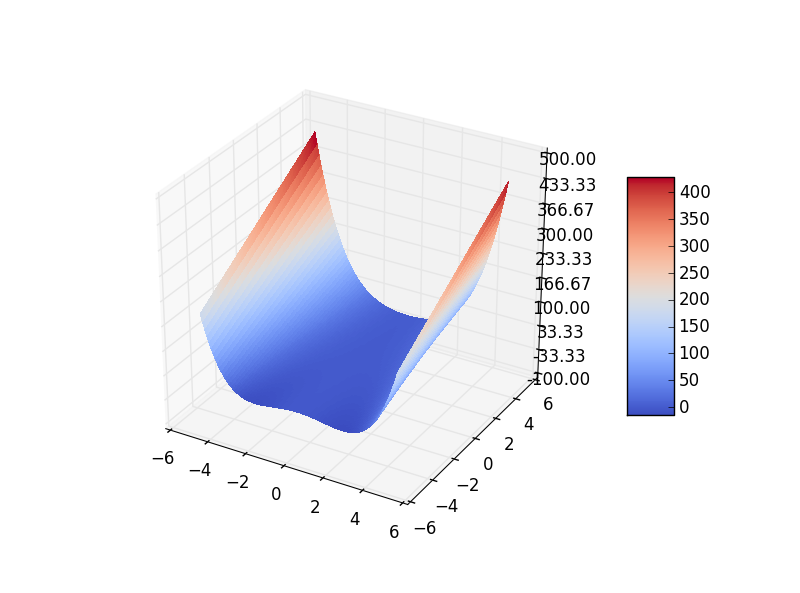
# -*- coding: utf-8 -*-
"""
Created on Sun Nov 02 15:35:05 2014

@author: Luo Hao at Tubic
"""

from mpl_toolkits.mplot3d import Axes3D
from matplotlib import cm
from matplotlib.ticker import LinearLocator, FormatStrFormatter
import matplotlib.pyplot as plt
import numpy as np
if __name__ == '__main__':
    x = np.linspace(-5, 5, 101)
    #y = np.linspace(-4, 4, 9001)
    #aList = np.linspace(-2, 2, 5)
    y = np.linspace(-5, 5, 101)
    fig = plt.figure()
    x, y = np.meshgrid(x, y)# sampling point
    ax = fig.add_subplot(111, projection='3d')
    #ax.plot(x, a, x**4/2 + a*x**2 - x/2 + a/4)
    ax.zaxis.set_major_locator(LinearLocator(10))
    ax.zaxis.set_major_formatter(FormatStrFormatter('%.02f'))
    #surf = ax.plot_surface(x, y, (4*y-2*x**4+2*x)/(4*x**2+1), rstride=1, cstride=1, cmap=cm.coolwarm,
    #    linewidth=0, antialiased=False)
    surf = ax.plot_surface(x, y, (x**4/2 + y*x**2 - x/2 + y/4), rstride=1, cstride=1, cmap=cm.coolwarm,
        linewidth=0, antialiased=False)
    fig.colorbar(surf, shrink=0.5, aspect=5) # color bar
    plt.show()
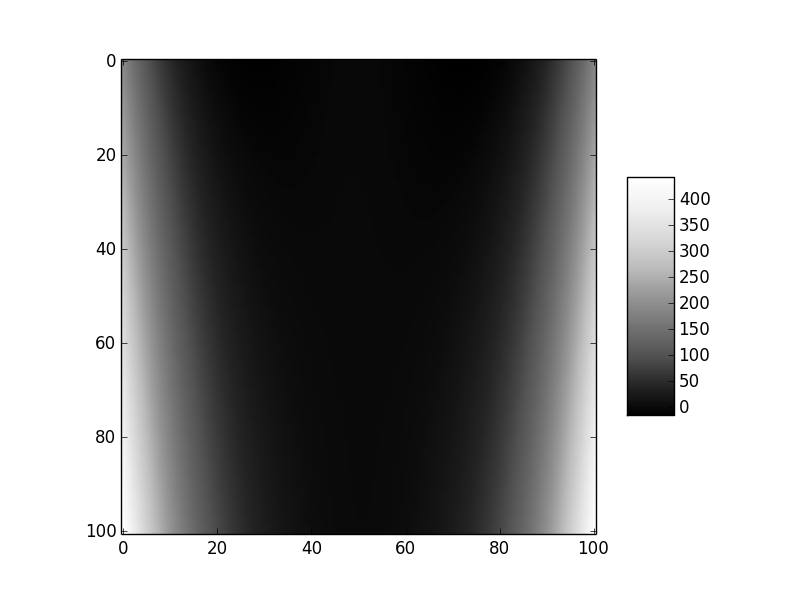
# -*- coding: utf-8 -*-
"""
Created on Sun Nov 02 15:35:05 2014

@author: Luo Hao at Tubic
"""

from mpl_toolkits.mplot3d import Axes3D
from matplotlib import cm
from matplotlib.ticker import LinearLocator, FormatStrFormatter
import matplotlib.pyplot as plt
import numpy as np
if __name__ == '__main__':
    x = np.linspace(-5, 5, 101)
    #y = np.linspace(-4, 4, 9001)
    #aList = np.linspace(-2, 2, 5)
    y = np.linspace(-5, 5, 101)
    fig = plt.figure()
    x, y = np.meshgrid(x, y)
    ax = fig.add_subplot(111)
    a = plt.imshow((x**4/2 + y*x**2 - x/2 + y/4), cmap = cm.Greys_r)
    fig.colorbar(a, shrink=0.5, aspect=5)
    plt.show()