1.logistic分类
几乎所有的教材都是从logistic回归开始的,logistic分类太经典了,而且它也是神经网络的组成部分,每一个神经元都可以看作是进行了一次logistics分类。
logistic即逻辑分类,是一种二分类方法。其算法流程也比较简单:线性求和、sigmoid激活、计算误差、优化参数。
1.1 线性求和以及sigmoid激活
第1,2步是用于根据输入来判断分类的,所以放在一起说。假设有n维的输入向量x,也有相应的n维参数列向量h,还有一个偏置量b,现行求和得到:
因为z的值域是[-∞,+∞],是无法根据z来做出x的逻辑(类别)判断的,因此我们引入了一个函数,将z的值映射到[0,1]之间,称之为激活函数。激活函数有很多种,这里的激活函数采用sigmoid。
当x越大,(sigma(x))越接近1,x越小$sigma(x)越接近0,x=0时值为0.5。所以:
a>0.5时属于正类,反之属于负类,这样便完成了分类工作。
1.2 误差计算和参数优化
训练就是对h和b进行寻优的过程。如何训练呢?首先我们需要定义一个损失函数(优化目标)。我们期望输入x判定为y,而实际得到的判定值是a,损失函数为(C(a,y))。
即可得到最优解。
注意:在大部分情况下,数据规模都比较大,或者属于非凸优化问题,不能这样直接得到最优解,而是通过迭代的方法。
其中(eta)为学习率。
定义平方损失函数为(C=(a-y)^2/2),可以得到:
每次迭代的公式为:
1.3 logistic推广到多类
用二分分类器解决多分类(k类)问题,可以采用一对多法,将某类作为正类,其他所有作为一类,构建k个分类器;或者一对一设计k(k-1)/2个分类器,再投票。当然更直接的是把输出值变为向量,直接输出属于每一类的概率。
前面的公式修改后,W变成了矩阵,b/z/a/y都变成了向量。
此时的(sigma)函数是对向量的每一个元素单独运算。得到向量a后其最大值所在的索引就是判别出的分类。修正后的优化公式:
注意向量之间有些是点乘。
2.简单的神经网络及后向传播
2.1 原理
最简单的神经网络:输入层-隐藏层 -输出层,分别记为x,h,y。
从输入层到隐藏层的矩阵记为(W_{hx}),偏置量为(b_{h});从隐藏层到输出层的矩阵记为(W_{yh}),偏置量为(b_{y}),得到:
不难看出,其实就是两层logistic的堆叠。按照传统的logistic算法,可以根据误差来优化(W_{hx},b_{h}),那么如何更新从输入到隐藏层的参数呢?这就要引入后向算法了,其核心是:链式法则
首先看(W_{hx},b_{h})的更新,
上面的公式中也用到了链式法则,类似地,可以得到:
可以看到(W_{hx},b_{h})的计算中使用了(frac{partial{C}}{partial{h_a}}),它是输出层传导到隐藏层的误差。在得到各个参数的偏导后便可以进行参数优化了。
2.2 实现
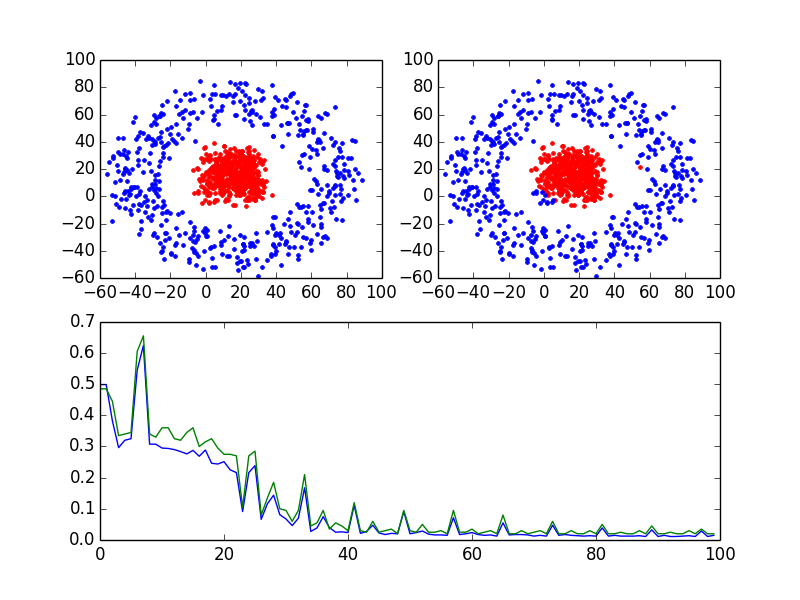
实例如下图:

左上角是实际的分类,右上角是分类器判别的分类,下面是误分率的趋势图,主要程序是train函数。
#!/usr/bin/python
# -*- coding:utf-8 -*-
# coding=utf-8
# Author: houkai
# Description:
#
import numpy as np
import matplotlib.pyplot as plt
import random
import math

# 构造各个分类
def gen_sample():
    data = []
    radius = [0,50]
    for i in range(1000):  # 生成10k个点
        catg = random.randint(0,1)  # 决定分类
        r = random.random()*10
        arg = random.random()*360
        len = r + radius[catg]
        x_c = math.cos(math.radians(arg))*len
        y_c = math.sin(math.radians(arg))*len
        x = random.random()*30 + x_c
        y = random.random()*30 + y_c
        data.append((x,y,catg))
    return data

def plot_dots(data):
    data_asclass = [[] for i in range(2)]
    for d in data:
        data_asclass[int(d[2])].append((d[0],d[1]))
    colors = ['r.','b.','r.','b.']
    for i,d in enumerate(data_asclass):
        # print(d)
        nd = np.array(d)
        plt.plot(nd[:,0],nd[:,1],colors[i])
    plt.draw()

def train(input, output, Whx, Wyh, bh, by):
    """
    完成神经网络的训练过程
    :param input:   输入列向量, 例如 [x,y].T
    :param output:  输出列向量, 例如[0,1,0,0].T
    :param Whx:     x->h 的参数矩阵
    :param Wyh:     h->y 的参数矩阵
    :param bh:      x->h 的偏置向量
    :param by:      h->y 的偏置向量
    :return:
    """
    h_z = np.dot(Whx, input) + bh   # 线性求和
    h_a = 1/(1+np.exp(-1*h_z))      # 经过sigmoid激活函数
    y_z = np.dot(Wyh, h_a) + by
    y_a = 1/(1+np.exp(-1*y_z))
    c_y = (y_a-output)*y_a*(1-y_a)
    dWyh = np.dot(c_y, h_a.T)
    dby = c_y
    c_h = np.dot(Wyh.T, c_y)*h_a*(1-h_a)
    dWhx = np.dot(c_h,input.T)
    dbh = c_h
    return dWhx,dWyh,dbh,dby,c_y

def test(train_set, test_set, Whx, Wyh, bh, by):
    train_tag = [int(x) for x in train_set[:,2]]
    test_tag = [int(x) for x in test_set[:,2]]
    train_pred = []
    test_pred = []

    for i,d in enumerate(train_set):
        input = train_set[i:i+1,0:2].T
        tag = predict(input,Whx,Wyh,bh,by)
        train_pred.append(tag)
    for i,d in enumerate(test_set):
        input = test_set[i:i+1,0:2].T
        tag = predict(input,Whx,Wyh,bh,by)
        test_pred.append(tag)
    # print(train_tag)
    # print(train_pred)
    train_err = 0
    test_err = 0
    for i in range(train_pred.__len__()):
        if train_pred[i]!=int(train_tag[i]):
            train_err += 1
    for i in range(test_pred.__len__()):
        if test_pred[i]!=int(test_tag[i]):
            test_err += 1
    # print(test_tag)
    # print(test_pred)
    train_ratio = float(train_err) / train_pred.__len__()
    test_ratio = float(test_err) / test_pred.__len__()
    return train_err,train_ratio,test_err,test_ratio

def predict(input,Whx,Wyh,bh,by):
    # print('-----------------')
    # print(input)
    h_z = np.dot(Whx, input) + bh   # 线性求和
    h_a = 1/(1+np.exp(-1*h_z))      # 经过sigmoid激活函数
    y_z = np.dot(Wyh, h_a) + by
    y_a = 1/(1+np.exp(-1*y_z))
    # print(y_a)
    tag = np.argmax(y_a)
    return tag

if __name__=='__main__':
    input_dim   = 2
    output_dim  = 2
    hidden_size = 200
    Whx = np.random.randn(hidden_size, input_dim)*0.01
    Wyh = np.random.randn(output_dim, hidden_size)*0.01
    bh  = np.zeros((hidden_size, 1))
    by  = np.zeros((output_dim, 1))
    data = gen_sample()
    plt.subplot(221)
    plot_dots(data)
    ndata = np.array(data)
    train_set = ndata[0:800,:]
    test_set = ndata[800:1000,:]
    train_ratio_list = []
    test_ratio_list = []
    for times in range(10000):
        i = times%train_set.__len__()
        input = train_set[i:i+1,0:2].T
        tag = int(train_set[i,2])
        output = np.zeros((2,1))
        output[tag,0] = 1
        dWhx,dWyh,dbh,dby,c_y = train(input,output,Whx,Wyh,bh,by)
        if times%100==0:
            train_err,train_ratio,test_err,test_ratio = test(train_set,test_set,Whx,Wyh,bh,by)
            print('times:{t}	 train ratio:{tar}	 test ratio: {ter}'.format(tar=train_ratio,ter=test_ratio,t=times))
            train_ratio_list.append(train_ratio)
            test_ratio_list.append(test_ratio)

        for param, dparam in zip([Whx, Wyh, bh, by],
                                 [dWhx,dWyh,dbh,dby]):
            param -= 0.01*dparam
    for i,d in enumerate(ndata):
        input = ndata[i:i+1,0:2].T
        tag = predict(input,Whx,Wyh,bh,by)
        ndata[i,2] = tag
    plt.subplot(222)
    plot_dots(ndata)
    # plt.figure()
    plt.subplot(212)
    plt.plot(train_ratio_list)
    plt.plot(test_ratio_list)
    plt.show()