1、数据集,某宝数据。
下载数据后,利用kettle将文本文件导入mysql数据库。数据time从 2014-11-18 00到2014-12-18 23。包含如下字段: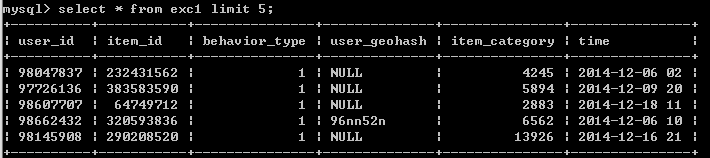
item_id(产品ID),behavior_type(包含点击、收藏、加购物车、购买四种行为,分别用数字1、2、3、4表示),user_geohash(地理位置),item_category(品类ID),time(发生行为的时间)。
2、目标
- 整体用户购物情况
- 用户行为转化漏斗
- 购买率高和购买率为 0 的人群有什么特征
- 基于时间维度了解用户的行为习惯
- 基于RFM模型的用户分析
3、数据清洗处理
1)缺失值
user_geohash列含大量NULL值,后续不对该字段处理
2)数据一致化处理
time字段含年月日和小时,将小时单独分解为1列。time列之前新建1列time的副本date 存年月日,time列存时间。方法用到replace和substring_index(按特点分隔符,分隔后索要截取字符串)
  alter table exc1 add date varchar(20) not null after item_category;

  update exc1 set date = time

  update exc1 set date = replace(date,date,substring_index(date,' ',1))

  update exc1 set time = replace(time, time, substring_index(time, ' ', -1 ))
3)behavior_type列4个值(点击1、收藏2、加购物车3、购买4)转换为‘pv’,'fav','cart','buy'
  update exc1 set  behavior_type = replace(behavior_type ,1,'pv');

  update exc1 set  behavior_type = replace(behavior_type ,2,'fav')

  update exc1 set  behavior_type = replace(behavior_type ,3,'cart')

  update exc1 set  behavior_type = replace(behavior_type ,4,'buy')
4) 查看表结构,发现date类型不是date型,将其转换为date型
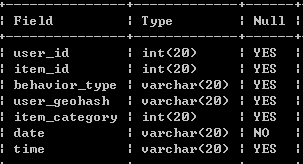
alter table exc1 modify date date;
4、构建模型及分析
1)整体用户购物情况
pv总访问量
select count(behavior_type) as '总访问量' from exc1 group by behavior_type having behavior_type = 'pv';

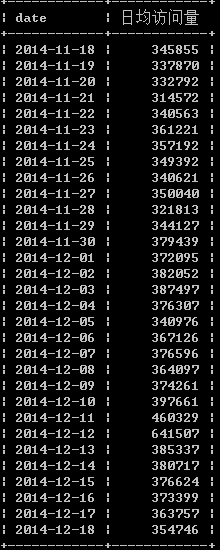
日均访问量
select date, count(behavior_type) as '日均访问量' from exc1 where behavior_type = 'pv' group by date order by date ;
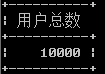
UV(用户总数)
select count(distinct user_id) '用户总数' from exc1;
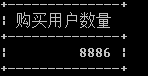
有购买行为的用户数量
select count(distinct user_id) '购买用户数量' from exc1 where behavior_type = 'buy';
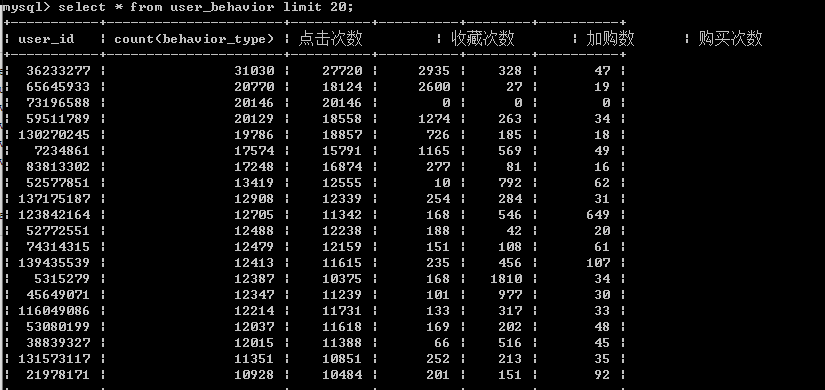
用户的购物情况
create view user_behavior as
select user_id, count(behavior_type),
sum(case when behavior_type = 'pv' then 1 else 0 end)  as '点击次数',
sum(case when behavior_type = 'fav' then 1 else 0 end)  as '收藏次数',
sum(case when behavior_type = 'cart' then 1 else 0 end)  as '加购数',
sum(case when behavior_type = 'buy' then 1 else 0 end)  as '购买次数'
from exc1
group by user_id
order by count(behavior_type) desc;
复购率
select concat(round(sum(case when 购买次数>=2 then 1 else 0 end)/sum(case when 购买次数>0 then 1 else 0 end)*100), '%') as '复购率'
from user_behavior

2)用户购买行为漏斗
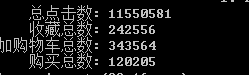
用户购物行为总计
select sum(点击次数) '总点击数', sum(收藏次数) '收藏总数',sum(加购数) '加购物车总数', sum(购买次数) '购买总数' from user_behavior;
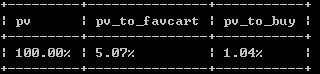
用户购买行为转换率
select CONCAT( round(sum(点击次数)*100/sum(点击次数),2),'%') as 'pv',
CONCAT( round((sum(收藏次数)+sum(加购数))*100/sum(点击次数),2),'%') as 'pv_to_favcart',
CONCAT( round(sum(购买次数)*100/sum(点击次数),2),'%') as 'pv_to_buy'
from user_behavior;
制作动态漏斗图:
import pandas as pd
import pyecharts as pec

dict = {'pv':100, 'pv_to_favcart':5.07,'pv_to_buy':1.04}
user = pd.DataFrame(data = dict,index= range(1))

attr = ['点击','收藏或加购物车','购买']
value = [user.ix[:,'pv'],user.ix[:,'pv_to_favcart'],user.ix[:,'pv_to_buy']]
funnel = pec.Funnel('用户行为漏斗图',width=800,height = 600,title_pos = 'left')
funnel.add(name = '用户行为情况' ,
		   attr = attr,
		   value = value,
		   is_label_show = True,
		   label_formatter ='{b}{c}%',
		   label_pos = 'outside',
		   is_legend_show = True
		   )

funnel.render()
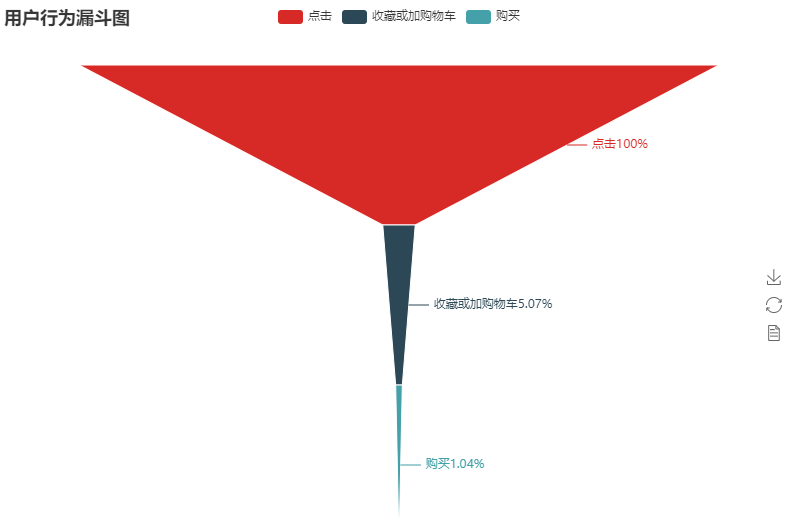
可以看出用户点击后收藏和加购物车的概率在5.04%左右,真正购买的只有1.04%,购买转化率比较低,说明后期还有很大的空间。
3)购买率高和购买率为0的人群特征分析
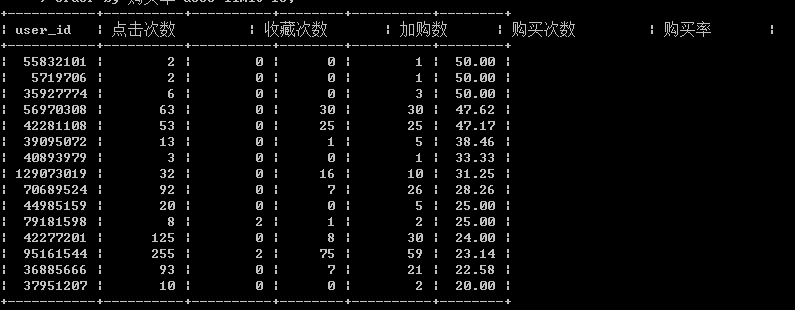
购买率高的人群特征(购买率降序排序):
select user_id, 点击次数,收藏次数,加购数,购买次数,
round(购买次数/点击次数*100,2) as 购买率
from user_behavior
group by user_id
order by 购买率 desc ;
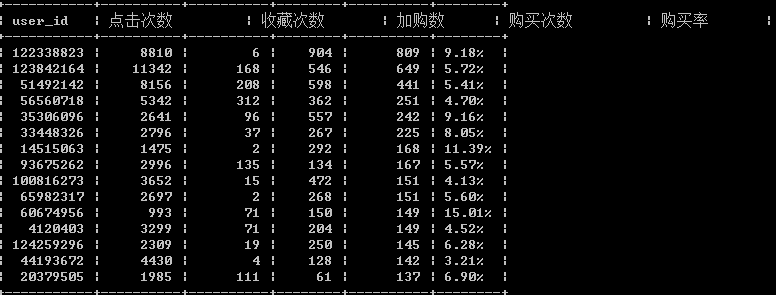
按购买次数进行排序(购买次数降序排序)
select user_id, 点击次数,收藏次数,加购数,购买次数,
concat(round(购买次数/点击次数*100,2),'%') as 购买率
from user_behavior
group by user_id
order by 购买次数 desc;
可以发现购买率高点击次数并不高,一部分人点击2次就购买了,这部分人没有收藏也没有加入购物车,属于有目的的购物群体,缺啥买啥,一般属于理智型购物群体。
购买率为0的人群:
select user_id, 点击次数,收藏次数,加购数,购买次数,
round(购买次数/点击次数*100,2) as 购买率
from user_behavior
group by user_id
order by 购买率 asc

点击次数多,加购物车或收藏较多考虑有可能是为商家活动做准备。
点击次数多,购买率低或为0的客户为克制型客户,此类客户爱比较,思虑多,自制性比较强。或者说不会支付。
4)基于时间维度了解用户行为习惯
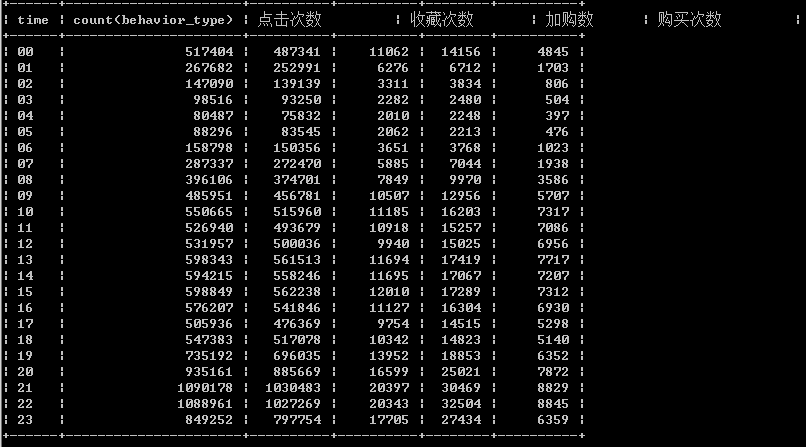
一天中用户活跃时段分布
select time, count(behavior_type),
sum(case when behavior_type = 'pv' then 1 else 0 end) as '点击次数',
sum(case when behavior_type = 'fav' then 1 else 0 end) as '收藏次数',
sum(case when behavior_type = 'cart' then 1 else 0 end) as '加购数',
sum(case when behavior_type = 'buy' then 1 else 0 end) as '购买次数'
from exc1
group by time
order by time
mysql数据导出为csv表:
select time, count(behavior_type),
sum(case when behavior_type = 'pv' then 1 else 0 end) as '点击次数',
sum(case when behavior_type = 'fav' then 1 else 0 end) as '收藏次数',
sum(case when behavior_type = 'cart' then 1 else 0 end) as '加购数',
sum(case when behavior_type = 'buy' then 1 else 0 end) as '购买次数'
from exc1
group by time
order by time
into outfile 'E:/Pro/users.csv' fields terminated by ','enclosed by '"'lines terminated by '
';
绘制双轴图:
import pandas as pd
import pyecharts as pec

names = ['time','count(behavior_type)','点击次数','收藏次数','加购数','购买次数']
data = pd.read_csv('E:/Pro/users.csv',header=None,names = names)
attr = ["{}时".format(i) for i in range(24)]


bar = pec.Bar('用户行为-时间图',width =1500,height= 600)
bar.add('用户行为总数量',attr, data.iloc[:,1],is_label_show=False)
bar.add('点击总量',attr, data.iloc[:,2])

line = pec.Line()
for i in range(3,len(names)):
	line.add(names[i],attr,data.iloc[:,i])

overlap = pec.Overlap()
overlap.add(bar)
overlap.add(line, yaxis_index=1, is_add_yaxis = True)
overlap.show_config()
overlap.render('./times.html')

由图形可以看出每天0-5点用户活跃度保存降低状态,4-5点至最低值,6-10点用户活跃度快速上升,10-18点活跃度保存平稳状态,17-23点活跃度持续上升,21-22时到达最高峰,23时有所下降。与用户的运营行为可以参与用户活跃时段进行。
一周中用户活跃分布
select date_format(date,'%W') as weeks, count(behavior_type),
sum(case when behavior_type = 'pv' then 1 else 0 end) as '点击次数',
sum(case when behavior_type = 'fav' then 1 else 0 end) as '收藏次数',
sum(case when behavior_type = 'cart' then 1 else 0 end) as '加购数',
sum(case when behavior_type = 'buy' then 1 else 0 end) as '购买次数'
from exc1
where date between '2014-11-23' and '2014-12-13'
group by weeks
order by weeks

同样绘制双轴图:
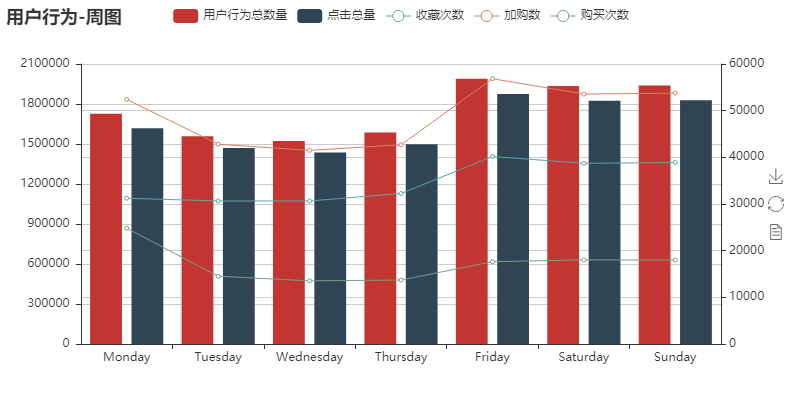
用户活跃度到周五上升比较明显,周五到周末小幅度下降,到周日又有慢慢的回升趋势。星期4到星期5用户活跃度激增,考虑可能是双12带来的影响。
5) 基于RFM模型找出有价值的客户
R-Recency: 最近一次购买时间
F-Frequency: 消费频率
M-Money:消费金额
数据集没有消费金额,对最近一次购买时间和消费频率进行评分
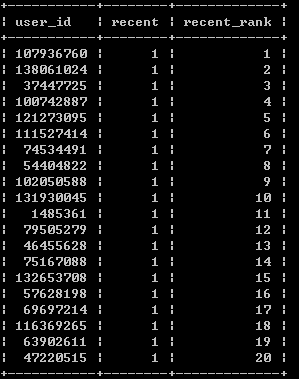
- 针对R-Recency评分(间隔天数越少客户价值越大,间隔天数升序排序)
select a.* ,
(@r:=@r+1) as recent_rank from (
select user_id, datediff('2014-12-19', max(date)) as recent from exc1
where behavior_type = 'buy'
group by user_id
order by recent
)a,(select @r:=0)b ;
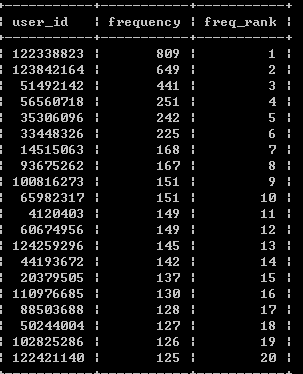
- 针对消费频率(F-Frequency)(购买频率越大,客户价值越大)
select a.* ,
(@r2:=@r2+1) as freq_rank from (
select user_id, count(behavior_type) as frequency from exc1
where behavior_type = 'buy'
group by user_id
order by frequency desc
)a,(select @r2:=0)b
- 联合合并2者,并加入评分关系
select m.user_id , n.frequency , recent_rank, freq_rank,
concat(
case when recent_rank <= (4330)/4 then '4'
when recent_rank > (4330)/4 and recent_rank <= (4330)/2 then '3'
when recent_rank > (4330)/2 and recent_rank <= (4330)/4*3 then '2'
else '1' end ,
case when freq_rank <= (4330)/4 then '4'
when freq_rank > (4330)/4 and freq_rank <= (4330)/2 then '3'
when freq_rank > (4330)/2 and freq_rank <= (4330)/4*3 then '2'
else '1' end
) as user_value
from (
select a.*,(@r1:=@r1+1) as recent_rank from (
select user_id, datediff('2014-12-19',max(date)) as recent
from exc1
where behavior_type = 'buy'
group by user_id  order by recent
) a, (select @r1:=0 )as b) m ,
( select a.* , (@r2:=@r2+1) as freq_rank from (
select user_id, count(behavior_type) as frequency
from exc1
where behavior_type = 'buy'
group by user_id order by frequency desc
)a ,(select @r2:=0) as b) as n
where m.user_id = n.user_id;
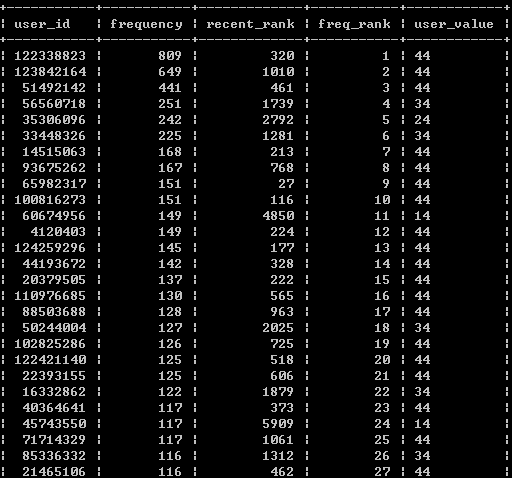
通过得分可以看出user_value 为‘41’的用户为关注频次比较高,购买能力不足的用户,可以选择适当促销打折或其他捆绑销售来促进客户下单
而user_value 为‘14’的用户这类关注度忠诚度不高,购买力强的客户需要关注其购物习性做精准化营销。