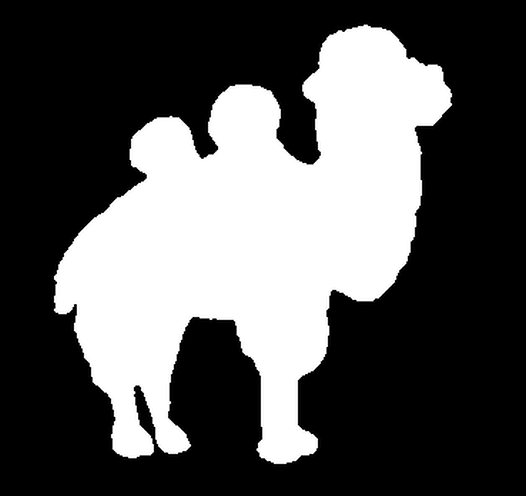
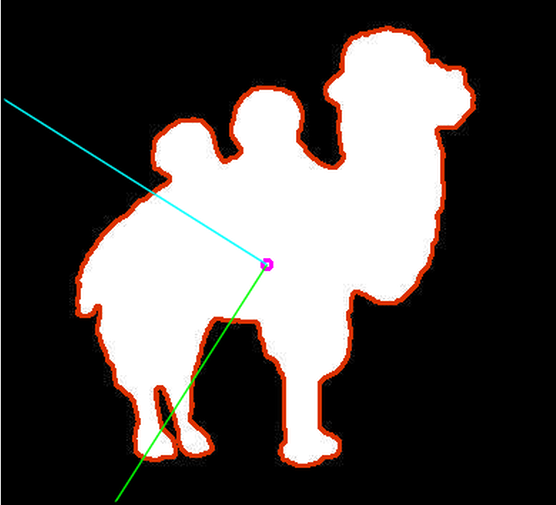
//求轮廓的方向
//第二个函数调用第一个
void drawAxis(Mat&, Point, Point, Scalar, const float);
double getOrientation(const vector<Point> &, Mat&);
函数方法如下:
 1 void drawAxis(Mat& img, Point p, Point q, Scalar colour, const float scale = 0.2)
 2 {
 3     double angle = atan2((double)p.y - q.y, (double)p.x - q.x); // angle in radians
 4     double hypotenuse = sqrt((double)(p.y - q.y) * (p.y - q.y) + (p.x - q.x) * (p.x - q.x));
 5     // Here we lengthen the arrow by a factor of scale
 6     q.x = (int)(p.x - scale * hypotenuse * cos(angle));
 7     q.y = (int)(p.y - scale * hypotenuse * sin(angle));
 8     line(img, p, q, colour, 1, LINE_AA);
 9     // create the arrow hooks
10     p.x = (int)(q.x + 9 * cos(angle + CV_PI / 4));
11     p.y = (int)(q.y + 9 * sin(angle + CV_PI / 4));
12     line(img, p, q, colour, 1, LINE_AA);
13     p.x = (int)(q.x + 9 * cos(angle - CV_PI / 4));
14     p.y = (int)(q.y + 9 * sin(angle - CV_PI / 4));
15     line(img, p, q, colour, 1, LINE_AA);
16 }
17 double getOrientation(const vector<Point> &pts, Mat &img)
18 {
19     //Construct a buffer used by the pca analysis
20     int sz = static_cast<int>(pts.size());
21     Mat data_pts = Mat(sz, 2, CV_64F);
22     for (int i = 0; i < data_pts.rows; i++)
23     {
24         data_pts.at<double>(i, 0) = pts[i].x;
25         data_pts.at<double>(i, 1) = pts[i].y;
26     }
27     //Perform PCA analysis
28     PCA pca_analysis(data_pts, Mat(), PCA::DATA_AS_ROW);
29     //Store the center of the object
30     Point cntr = Point(static_cast<int>(pca_analysis.mean.at<double>(0, 0)),
31         static_cast<int>(pca_analysis.mean.at<double>(0, 1)));
32     //Store the eigenvalues and eigenvectors
33     vector<Point2d> eigen_vecs(2);
34     vector<double> eigen_val(2);
35     for (int i = 0; i < 2; i++)
36     {
37         eigen_vecs[i] = Point2d(pca_analysis.eigenvectors.at<double>(i, 0),
38             pca_analysis.eigenvectors.at<double>(i, 1));
39         eigen_val[i] = pca_analysis.eigenvalues.at<double>(i);
40     }
41     // Draw the principal components
42     circle(img, cntr, 3, Scalar(255, 0, 255), 2);
43     Point p1 = cntr + 0.02 * Point(static_cast<int>(eigen_vecs[0].x * eigen_val[0]), static_cast<int>(eigen_vecs[0].y * eigen_val[0]));
44     Point p2 = cntr - 0.02 * Point(static_cast<int>(eigen_vecs[1].x * eigen_val[1]), static_cast<int>(eigen_vecs[1].y * eigen_val[1]));
45     drawAxis(img, cntr, p1, Scalar(0, 255, 0), 1);
46     drawAxis(img, cntr, p2, Scalar(255, 255, 0), 5);
47     double angle = atan2(eigen_vecs[0].y, eigen_vecs[0].x); // orientation in radians
48     return angle;
49 }
例子:
#include "opencv2/core.hpp"
#include "opencv2/imgproc.hpp"
#include "opencv2/highgui.hpp"
#include <iostream>
using namespace std;
using namespace cv;
// Function declarations
void drawAxis(Mat&, Point, Point, Scalar, const float);
double getOrientation(const vector<Point> &, Mat&);
void drawAxis(Mat& img, Point p, Point q, Scalar colour, const float scale = 0.2)
{
    double angle = atan2((double)p.y - q.y, (double)p.x - q.x); // angle in radians
    double hypotenuse = sqrt((double)(p.y - q.y) * (p.y - q.y) + (p.x - q.x) * (p.x - q.x));
    // Here we lengthen the arrow by a factor of scale
    q.x = (int)(p.x - scale * hypotenuse * cos(angle));
    q.y = (int)(p.y - scale * hypotenuse * sin(angle));
    line(img, p, q, colour, 1, LINE_AA);
    // create the arrow hooks
    p.x = (int)(q.x + 9 * cos(angle + CV_PI / 4));
    p.y = (int)(q.y + 9 * sin(angle + CV_PI / 4));
    line(img, p, q, colour, 1, LINE_AA);
    p.x = (int)(q.x + 9 * cos(angle - CV_PI / 4));
    p.y = (int)(q.y + 9 * sin(angle - CV_PI / 4));
    line(img, p, q, colour, 1, LINE_AA);
}
double getOrientation(const vector<Point> &pts, Mat &img)
{
    //Construct a buffer used by the pca analysis
    int sz = static_cast<int>(pts.size());
    Mat data_pts = Mat(sz, 2, CV_64F);
    for (int i = 0; i < data_pts.rows; i++)
    {
        data_pts.at<double>(i, 0) = pts[i].x;
        data_pts.at<double>(i, 1) = pts[i].y;
    }
    //Perform PCA analysis
    PCA pca_analysis(data_pts, Mat(), PCA::DATA_AS_ROW);
    //Store the center of the object
    Point cntr = Point(static_cast<int>(pca_analysis.mean.at<double>(0, 0)),
        static_cast<int>(pca_analysis.mean.at<double>(0, 1)));
    //Store the eigenvalues and eigenvectors
    vector<Point2d> eigen_vecs(2);
    vector<double> eigen_val(2);
    for (int i = 0; i < 2; i++)
    {
        eigen_vecs[i] = Point2d(pca_analysis.eigenvectors.at<double>(i, 0),
            pca_analysis.eigenvectors.at<double>(i, 1));
        eigen_val[i] = pca_analysis.eigenvalues.at<double>(i);
    }
    // Draw the principal components
    circle(img, cntr, 3, Scalar(255, 0, 255), 2);
    Point p1 = cntr + 0.02 * Point(static_cast<int>(eigen_vecs[0].x * eigen_val[0]), static_cast<int>(eigen_vecs[0].y * eigen_val[0]));
    Point p2 = cntr - 0.02 * Point(static_cast<int>(eigen_vecs[1].x * eigen_val[1]), static_cast<int>(eigen_vecs[1].y * eigen_val[1]));
    drawAxis(img, cntr, p1, Scalar(0, 255, 0), 1);
    drawAxis(img, cntr, p2, Scalar(255, 255, 0), 5);
    double angle = atan2(eigen_vecs[0].y, eigen_vecs[0].x); // orientation in radians
    return angle;
}
int main()
{

    Mat src = imread("4.png");
    Mat gray;
    cvtColor(src, gray, COLOR_BGR2GRAY);
    // Convert image to binary
    Mat bw;
    threshold(gray, bw, 50, 255, THRESH_BINARY | THRESH_OTSU);
    // Find all the contours in the thresholded image
    vector<vector<Point> > contours;
    findContours(bw, contours, RETR_LIST, CHAIN_APPROX_NONE);
    for (size_t i = 0; i < contours.size(); i++)
    {

        drawContours(src, contours, i, Scalar(0, 50, 220), 2);
        // Find the orientation of each shape
        getOrientation(contours[i], src);
    }
    imshow("output", src);
    waitKey();
    return 0;
}


