先给大家看下我做出来的和echarts官网做出来的 代码什么的都是一模一样但是颜色不一样 它字的颜色和柱状图颜色还一样不知道是不是脑子有猫病~
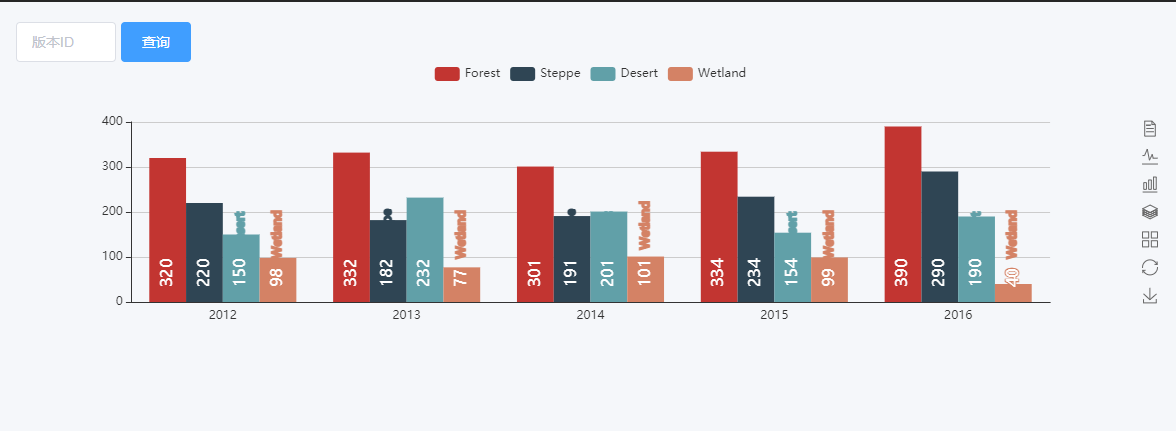
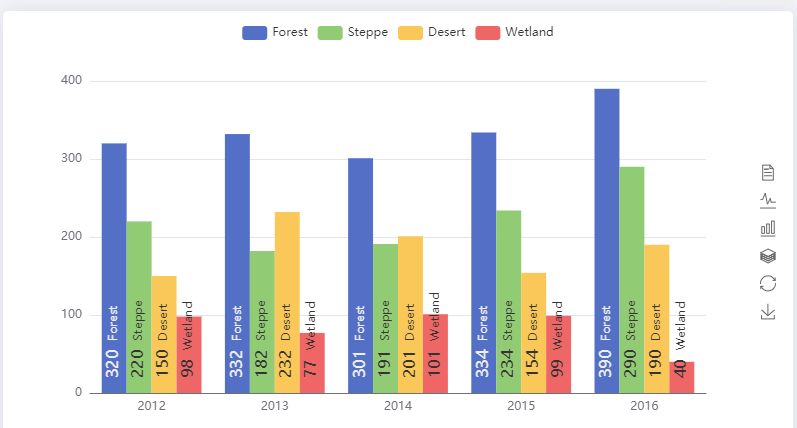
上面是我做的 下面是官网的
主要是代码都是一样 我又不是某宝买衣服 颜色差别这么大呢?
我给你们看代码下面是我写的
<template>
  <div>
    <div class="echarts" ref="echarts"></div>
  </div>
</template>
<script>
import echarts from 'echarts'
export default {
  name: 'dailyJournal',
  data() {
    return {
      chart: null,
      myChart: null,
      option: {},
    }
  },
  methods: {
    draw() {
      this.chart = this.$refs.echarts
      this.chart.style.height = 300 + 'px'
      this.myChart = echarts.init(this.chart)
      var app = {}
      var posList = [
        'left',
        'right',
        'top',
        'bottom',
        'inside',
        'insideTop',
        'insideLeft',
        'insideRight',
        'insideBottom',
        'insideTopLeft',
        'insideTopRight',
        'insideBottomLeft',
        'insideBottomRight'
      ]

      app.configParameters = {
        rotate: {
          min: -90,
          max: 90
        },
        align: {
          options: {
            left: 'left',
            center: 'center',
            right: 'right'
          }
        },
        verticalAlign: {
          options: {
            top: 'top',
            middle: 'middle',
            bottom: 'bottom'
          }
        },
        position: {
          options: posList.reduce(function(map, pos) {
            map[pos] = pos
            return map
          }, {})
        },
        distance: {
          min: 0,
          max: 100
        }
      }

      app.config = {
        rotate: 90,
        align: 'left',
        verticalAlign: 'middle',
        position: 'insideBottom',
        distance: 15,
        onChange: function() {
          var labelOption = {
            normal: {
              rotate: app.config.rotate,
              align: app.config.align,
              verticalAlign: app.config.verticalAlign,
              position: app.config.position,
              distance: app.config.distance
            }
          }
          this.myChart.setOption({
            series: [
              {
                label: labelOption
              },
              {
                label: labelOption
              },
              {
                label: labelOption
              },
              {
                label: labelOption
              }
            ]
          })
        }
      }

      var labelOption = {
        show: true,
        position: app.config.position,
        distance: app.config.distance,
        align: app.config.align,
        verticalAlign: app.config.verticalAlign,
        rotate: app.config.rotate,
        formatter: '{c}  {name|{a}}',
        fontSize: 16,
        rich: {
          name: {}
        }
      }

      this.option = {
        tooltip: {
          trigger: 'axis',
          axisPointer: {
            type: 'shadow'
          }
        },
        legend: {
          data: ['Forest', 'Steppe', 'Desert', 'Wetland']
        },
        toolbox: {
          show: true,
          orient: 'vertical',
          left: 'right',
          top: 'center',
          feature: {
            mark: { show: true },
            dataView: { show: true, readOnly: false },
            magicType: { show: true, type: ['line', 'bar', 'stack', 'tiled'] },
            restore: { show: true },
            saveAsImage: { show: true }
          }
        },
        xAxis: [
          {
            type: 'category',
            axisTick: { show: false },
            data: ['2012', '2013', '2014', '2015', '2016']
          }
        ],
        yAxis: [
          {
            type: 'value'
          }
        ],
        series: [
          {
            name: 'Forest',
            type: 'bar',
            barGap: 0,
            label: labelOption,
            emphasis: {
              focus: 'series'
            },
            data: [320, 332, 301, 334, 390]
          },
          {
            name: 'Steppe',
            type: 'bar',
            label: labelOption,
            emphasis: {
              focus: 'series'
            },
            data: [220, 182, 191, 234, 290]
          },
          {
            name: 'Desert',
            type: 'bar',
            label: labelOption,
            emphasis: {
              focus: 'series'
            },
            data: [150, 232, 201, 154, 190]
          },
          {
            name: 'Wetland',
            type: 'bar',
            label: labelOption,
            emphasis: {
              focus: 'series'
            },
            data: [98, 77, 101, 99, 40]
          }
        ]
      }

      this.myChart.setOption(this.option)
      // this.$nextTick(() => {
      window.addEventListener('resize', () => {
        this.myChart.resize()
      })
      // })
    }
  },
  mounted() {
     this.draw()
  }
}
</script>

<style></style>
下面看官网的 我都是下载示例copy官网一模一样
<!DOCTYPE html>
<html style="height: 100%">
    <head>
        <meta charset="utf-8">
    </head>
    <body style="height: 100%; margin: 0">
        <div id="container" style="height: 100%"></div>

        <script type="text/javascript" src="https://cdn.jsdelivr.net/npm/echarts@5/dist/echarts.min.js"></script>

        <script type="text/javascript">
var dom = document.getElementById("container");
var myChart = echarts.init(dom);
var app = {};

var option;


var posList = [
    'left', 'right', 'top', 'bottom',
    'inside',
    'insideTop', 'insideLeft', 'insideRight', 'insideBottom',
    'insideTopLeft', 'insideTopRight', 'insideBottomLeft', 'insideBottomRight'
];

app.configParameters = {
    rotate: {
        min: -90,
        max: 90
    },
    align: {
        options: {
            left: 'left',
            center: 'center',
            right: 'right'
        }
    },
    verticalAlign: {
        options: {
            top: 'top',
            middle: 'middle',
            bottom: 'bottom'
        }
    },
    position: {
        options: posList.reduce(function (map, pos) {
            map[pos] = pos;
            return map;
        }, {})
    },
    distance: {
        min: 0,
        max: 100
    }
};

app.config = {
    rotate: 90,
    align: 'left',
    verticalAlign: 'middle',
    position: 'insideBottom',
    distance: 15,
    onChange: function () {
        var labelOption = {
            normal: {
                rotate: app.config.rotate,
                align: app.config.align,
                verticalAlign: app.config.verticalAlign,
                position: app.config.position,
                distance: app.config.distance
            }
        };
        myChart.setOption({
            series: [{
                label: labelOption
            }, {
                label: labelOption
            }, {
                label: labelOption
            }, {
                label: labelOption
            }]
        });
    }
};


var labelOption = {
    show: true,
    position: app.config.position,
    distance: app.config.distance,
    align: app.config.align,
    verticalAlign: app.config.verticalAlign,
    rotate: app.config.rotate,
    formatter: '{c}  {name|{a}}',
    fontSize: 16,
    rich: {
        name: {
        }
    }
};

option = {
    tooltip: {
        trigger: 'axis',
        axisPointer: {
            type: 'shadow'
        }
    },
    legend: {
        data: ['Forest', 'Steppe', 'Desert', 'Wetland']
    },
    toolbox: {
        show: true,
        orient: 'vertical',
        left: 'right',
        top: 'center',
        feature: {
            mark: {show: true},
            dataView: {show: true, readOnly: false},
            magicType: {show: true, type: ['line', 'bar', 'stack', 'tiled']},
            restore: {show: true},
            saveAsImage: {show: true}
        }
    },
    xAxis: [
        {
            type: 'category',
            axisTick: {show: false},
            data: ['2012', '2013', '2014', '2015', '2016']
        }
    ],
    yAxis: [
        {
            type: 'value'
        }
    ],
    series: [
        {
            name: 'Forest',
            type: 'bar',
            barGap: 0,
            label: labelOption,
            emphasis: {
                focus: 'series'
            },
            data: [320, 332, 301, 334, 390]
        },
        {
            name: 'Steppe',
            type: 'bar',
            label: labelOption,
            emphasis: {
                focus: 'series'
            },
            data: [220, 182, 191, 234, 290]
        },
        {
            name: 'Desert',
            type: 'bar',
            label: labelOption,
            emphasis: {
                focus: 'series'
            },
            data: [150, 232, 201, 154, 190]
        },
        {
            name: 'Wetland',
            type: 'bar',
            label: labelOption,
            emphasis: {
                focus: 'series'
            },
            data: [98, 77, 101, 99, 40]
        }
    ]
};

if (option && typeof option === 'object') {
    myChart.setOption(option);
}

        </script>
    </body>
</html>
想问下大神们我都没有改啥为什么差别这么大 颜色也不知道在哪里改。。。。。