最近,做了一个HTML5的项目,里面涉及到了雷达图效果,这里,我将react实战项目中,用到的雷达图单拎出来写一篇博客,供大家学习。
以下内容涉及的代码在我的gitlab仓库中:
Konva canvas雷达图示例
仓库中有原生js实现的代码以及konva实现的代码!
先看效果图:
1. konva简单了解
现在js社区非常发达,有很多强大的插件,可以简化开发者的工作,我这里选用的canvas 2d插件是konva,它机会可以绘制我们能想到的所有平面图形,学习参考地址:
https://konvajs.org/docs/
这里我们简单了解下konva是如何工作的:
- konva的一起工作开始于Konva.stage, 它可以包含一个或者多个 Konva.Layer.
- 每一个 Konva.Layer 都有两个canvas渲染出来,一个画布用户显示,一个隐藏画布用于高性能事件监测
- 每一个 layer可以包含 shapes, groups
- groups可以包含 groups以及shapes
- stage, layers, groups, shapes都是 vitual nodes,类似于html页面的DOM nodes
- 所有的nodes都能够被设置style以及做transform动画效果
konva的Node等级如下图:

2. react中引入konva
有两种方式引入,一种是npm安装之后,使用import引入
还有一种直接在html文件的<head></head>中引入,我建议直接使用文件引入,可以使用cdn加速,并且在react的index.html中引入后,可以直接使用Konva这个全局变量
<script src="https://unpkg.com/konva@4.0.0/konva.min.js"></script>
3. 图形绘制
在react入口文件,引入绘制图形的js代码,获取canvas画布的大小后,调用绘制方法进行绘制图形。
在绘制图形前,先构造一个json数据,存放在state中:
    this.state = {
      data: {
        "label": "Your score:",
        "score": 92,
        "scores": [
          { "type": "health", "score": "98" },
          { "type": "wealth", "score": "93" },
          { "type": "career", "score": "90" },
          { "type": "love", "score": "83" },
          { "type": "happiness", "score": "87" }
        ]
      }
    }
App.js所有代码如下:
import React, { Component } from 'react';
import './App.css';

import { initScene } from './tools/renderRadar.js';

class App extends Component {
  constructor(props) {
    super(props);
    // 雷达图数据
    this.state = {
      data: {
        "label": "Your score:",
        "score": 92,
        "scores": [
          { "type": "health", "score": "98" },
          { "type": "wealth", "score": "93" },
          { "type": "career", "score": "90" },
          { "type": "love", "score": "83" },
          { "type": "happiness", "score": "87" }
        ]
      }
    }
  }

  componentDidMount() {
    const { data } = this.state;
    // 获取canvas画布的宽度
    const offsetWidth = document.getElementById('radar-canvas').offsetWidth;
    // 绘制canvas
    initScene(data, offsetWidth, offsetWidth);
  }

  render() {
    return (
      <div className="App">
        <div className="demo">
          <h1>Konva canvas demo:</h1>
          <div className="radar-canvas" id="radar-canvas"></div>
        </div>
      </div>
    );
  }
}

export default App;
上面代码中调用 initScene来绘制canvas图像,我先简单写一下这个函数的结构
const Konva = window.Konva;

let canvasHeight = 540;
let canvasWidth = 540;

// 用于获取一个可变的值,这个值和canvas画布的宽度等比例
function ratio(num){
  return canvasWidth * num;
}
/**
 * 绘制canvas
 * @param init 雷达图数据结构
 * @param offsetWidth canvas画布宽度
 * @param offsetHeight canvas画布高度
 * @returns {Konva.Stage}
 */
function initScene(init, offsetWidth, offsetHeight) {
  // 设置画布大小
  canvasHeight = offsetHeight;
  canvasWidth = offsetWidth;
  // 创建Konva Stage,实际上就是创建一个canvas画布
  const stage = new Konva.Stage({
    container: 'radar-canvas',
     canvasWidth,
    height: canvasHeight,
  });
  // 创建一个Konva layer
  const layer = new Konva.Layer();

  // todo:: 绘制雷达底图

  // todo:: 绘制雷达数值图

  // todo:: 绘制文字

  // todo:: 绘制各角文字

  // 添加layer到stage
  stage.add(layer);

  // 绘制layer
  layer.draw();

  // 这里返回stage,可以用户调用函数获取画布信息,比如用户获取base64信息等
  return stage;
}
注意这里有一个ratio方法,这个方法可用于设置等比的大小,用于适配各种分辨率的移动设备。
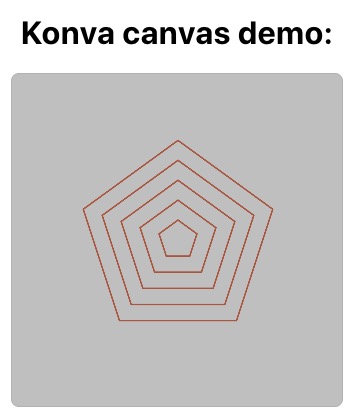
1)雷达底图绘制
雷达底图主要是使用Konva.RegularPolygon来绘制等边多边形的。
/**
 * 绘制雷达地图
 * @param stage
 * @returns {Konva.Group}
 */
function getPentagon(stage) {
  // 创建一个组,用于容纳5个大小递减的多边形,
  // group的大小正好是整个canvas画布的大小
  const group = new Konva.Group({
    x: 0,
    y: 0,
     stage.width(),
    height: stage.height(),
    offsetX: 0,
    offsetY: 0,
  });
  for (let i = 0; i < 5; i++) {
    let radius = stage.width() * 0.3; // 这个为外圈的半径
    radius = radius / 5 * (i + 1); // 5等分半径
    // 创建一个等边多边形
    const pentagon = new Konva.RegularPolygon({
      x: stage.width() / 2,
      y: stage.height() / 2,
      sides: 5, // 边数
      radius, // 半径
      fill: 'transparent', // 填充颜色
      stroke: '#b04119', // 边框颜色
      strokeWidth: ratio(1 / 640 * 3), // 边框宽度
      opacity: 0.8,
    });
    group.add(pentagon);
  }

  return group;
}
在initScene函数中调用:
// 绘制雷达底图
const pentagonGroup = getPentagon(stage);
layer.add(pentagonGroup);
绘制后如下图:
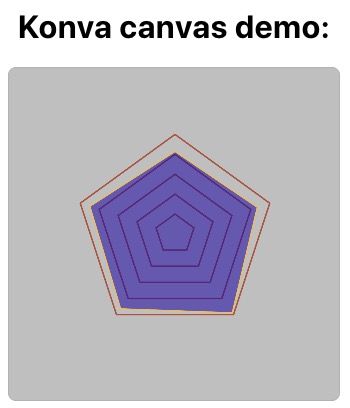
2)雷达数值图绘制
使用Konva.shap可以绘制不规则的图形,实际上就是利用了canvas的moveTo, lineTo的功能:
/**
 * 绘制数值图
 * @param init
 * @param stage
 * @returns {Konva.Shape}
 */
function getValues(init, stage) {
  const topics = init.scores;
  // 按照实际数组大小进行360的n等分
  const angle = Math.floor(360 / topics.length);
  // 便宜角度,用于和雷达底图角度对齐
  const offsetAngle = -angle / 4;
  // 绘制不规则图形
  const triangle = new Konva.Shape({
    sceneFunc(context, shape) {
      context.beginPath();
      const startX = stage.width() / 2;
      const startY = stage.height() / 2;
      for (let i = 0; i < topics.length; i++) {
        const value = getValuePoint(startX, startY, topics[i].score, angle * (i + 1) + offsetAngle);
        if (i === 0) {
          context.moveTo(value.x, value.y);
        } else {
          context.lineTo(value.x, value.y);
        }
      }
      context.closePath();
      context.fillStrokeShape(shape);
    },
    fill: '#2c00b0',
    stroke: '#ffc71d',
    strokeWidth: ratio(1 / 640 * 3),
    opacity: 0.6,
  });
  return triangle;
}

/**
 * 根据分数获取需要移动的坐标
 * @param xDef 中心点x
 * @param yDef 中心点y
 * @param value 数值
 * @param angle 偏移角度
 * @returns {{x: *, y: *}}
 */
function getValuePoint(xDef, yDef, value, angle) {
  // rat为底图外圈的半径*value/100
  const rat = ratio(0.3) / 100 * value;
  const x = xDef + rat * Math.cos(angle * Math.PI / 180);
  const y = yDef + rat * Math.sin(angle * Math.PI / 180);
  return {
    x,
    y,
  };
}
在initScene中调用方法绘制:
// 绘制雷达数值图
const values = getValues(init, stage);
layer.add(values);
绘制后图形:
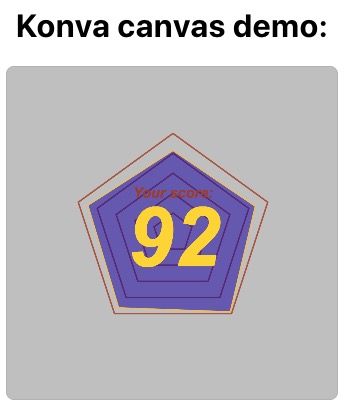
3)雷达文字绘制
文字就是调用Konva.Text进行绘制,很简单,直接贴代码:
  // 绘制文字
  const text = new Konva.Text({
    text: init.label,
    fill: '#b04119',
    fontSize: ratio(1 / 640 * 28),
    fontStyle: 'bold italic',
    fontFamily: 'Arial',
    x: stage.width() / 2, // x设置为中心点
    y: stage.height() / 2, // y设置为中心点
    align: 'center', // 文字对齐方式
    offsetY: ratio(1 / 640 * 90),
    opacity: 1,
  });
  text.offsetX(text.width() / 2); // 对text向左偏移50%
  layer.add(text);
  const textScore = new Konva.Text({
    text: init.score,
    fill: '#ffda1d',
    fontSize: ratio(1 / 640 * 160),
    fontStyle: 'bold italic',
    fontFamily: 'Arial',
    x: stage.width() / 2,
    align: 'center',
    y: stage.height() / 2,
    offsetY: ratio(1 / 640 * 60),
    opacity: 1,
  });
  textScore.offsetX(textScore.width() / 2);
  layer.add(textScore);
绘制后图:
4)各角文字绘制
绘制各角文字,同样利用了getValuePoint方法获取每个定点的坐标位置:
// 首字母大写
function titleCase(str) {
  const arr = str.split(' ');
  for (let i = 0; i < arr.length; i++) {
    arr[i] = arr[i].slice(0, 1).toUpperCase() + arr[i].slice(1).toLowerCase();
  }
  return arr.join(' ');
}

function getTopics(init, layer, stage) {
  const topics = init.scores;

  const angle = Math.floor(360 / topics.length);
  const offsetAngle = -angle / 4;
  const startX = stage.width() / 2;
  const startY = stage.height() / 2;
  for (let i = 0; i < topics.length; i++) {
    const angleCur = angle * (i + 1) + offsetAngle;
    // 获取角坐标
    const pointCoordinate = getValuePoint(startX, startY, 115, angleCur);
    // 设置container, 每个container都以离五边形的定点15%的距离为中心点
    // 宽度为画布宽度,高度为画布高度
    const container = new Konva.Group({
      x: pointCoordinate.x,
      y: pointCoordinate.y,
       stage.width(),
      height: stage.height(),
      offsetX: stage.width() / 2,
      offsetY: stage.height() / 2,
    });

    const topic = topics[i];
    // 文本
    const value = titleCase(`${topic.type}:
${topic.score}`);
    const text = new Konva.Text({
      text: value,
      fill: '#671fc5',
      fontSize: ratio(0.04),
      fontStyle: 'bold',
      fontFamily: 'Arial',
      x: stage.width() / 2,
      y: stage.height() / 2,
      align: 'center',
      offsetX: 0,
      offsetY: 0,
    });
    // 文本向左,向上分别偏移50%,达到在container居中的效果
    text.offsetX(text.width() / 2);
    text.offsetY(text.height() / 2);
    // 添加文字到container
    container.add(text);
    // 添加container到layer
    layer.add(container);
  }
}
在initScene中调用:
// 绘制各角文字
getTopics(init, layer, stage);
这样就得到了最终结果图:
绘制这个雷达图,多次使用了数学函数,计算左边,实际上就是利用了直角三角形边的计算方法
Math.cos()
Math.sin()
到这里,这篇文章就结束啦,后面有空,我会使用原生的canvas把这个图重新画一遍。
-------------
https://github.com/BowenHBX/konva-canvas-regularpolygon/blob/master/src/tools/renderPureRadar.js