对于subplots_adjust()函数,我们可以想象成对word页面布局的调整
说明、参数
Adjusting the spacing of margins and subplots调整边距和子图的间距
Adjusting the spacing of margins and subplots调整边距和子图的间距
subplots_adjust(self, left=None, bottom=None, right=None, top=None,wspace=None, hspace=None)
Tune the subplot layout.调整子图布局。
The parameter meanings (and suggested defaults) are:参数含义(和建议的默认值)是:
left = 0.125 # the left side of the subplots of the figure图片中子图的左侧
right = 0.9 # the right side of the subplots of the figure图片中子图的右侧
bottom = 0.1 # the bottom of the subplots of the figure图片中子图的底部
top = 0.9 # the top of the subplots of the figure图片中子图的顶部
wspace = 0.2 # the amount of width reserved for space between subplots,
# expressed as a fraction of the average axis width
#为子图之间的空间保留的宽度,平均轴宽的一部分
hspace = 0.2 # the amount of height reserved for space between subplots,
# expressed as a fraction of the average axis height
#为子图之间的空间保留的高度,平均轴高度的一部分
加了这个语句,子图会稍变小,因为空间也占用坐标轴的一部分
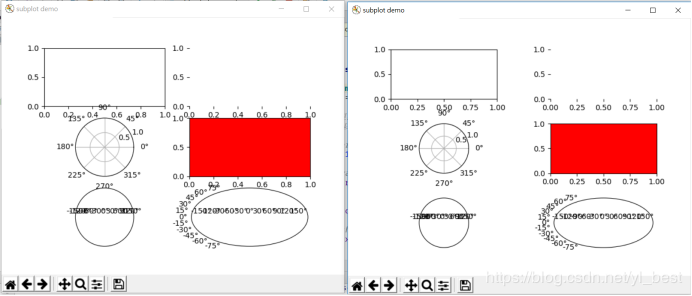
fig.subplots_adjust(wspace=0.5,hspace=0.5)
对比效果图:
右图是加加了subplots_adjust的